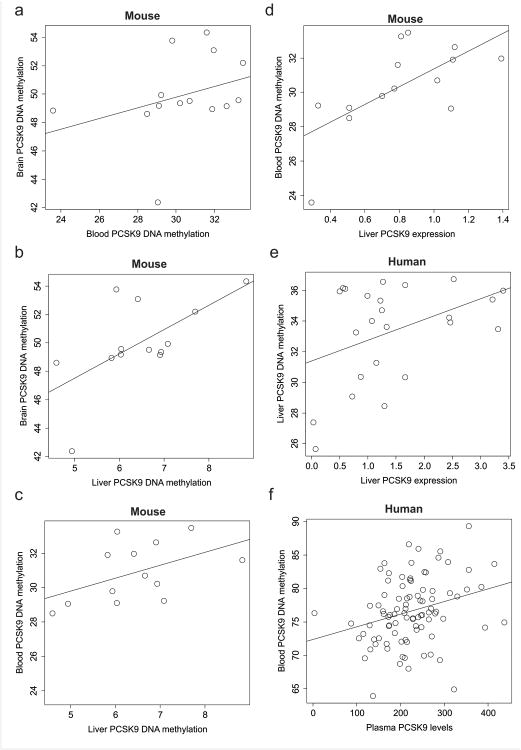
Figure 3. Cross-tissue-specific PCSK9 methylation and association with gene expression and plasma levels.
a-c cross-tissue correlations: (a) Mouse syntenic PCSK9 DNA methylation in brain (y-axis) as a function of blood (x-axis) (Rho= 0.51, P= 0.064). (b) A scatterplot of mouse syntenic PCSK9 DNA methylation in brain (y-axis) as a function of liver (x-axis) (Rho= 0.62, P= 0.021). (c) A scatterplot of mouse syntenic PCSK9 DNA methylation in blood (y-axis) as a function of liver (x-axis) (Rho= 0.49, P= 0.087).
d-f methylation to expression correlations: (d) Mouse syntenic PCSK9 DNA methylation in blood (y-axis) as a function of liver-specific PCSK9 gene expression (x-axis) (Rho= 0.67, P= 0.0086). (e) Human PCSK9 DNA methylation in blood (y-axis) as a function of liver-specific PCSK9 gene expression from healthy controls (n= 47) (x-axis) (Rho= 0.41, P= 0.046). (f) PCSK9CpG1 DNA methylation (x-axis) as a function of plasma levels of PCSK9 (y-axis) in individuals with AUD (n= 90) (Rho = 0.31, P= 0.0027).

