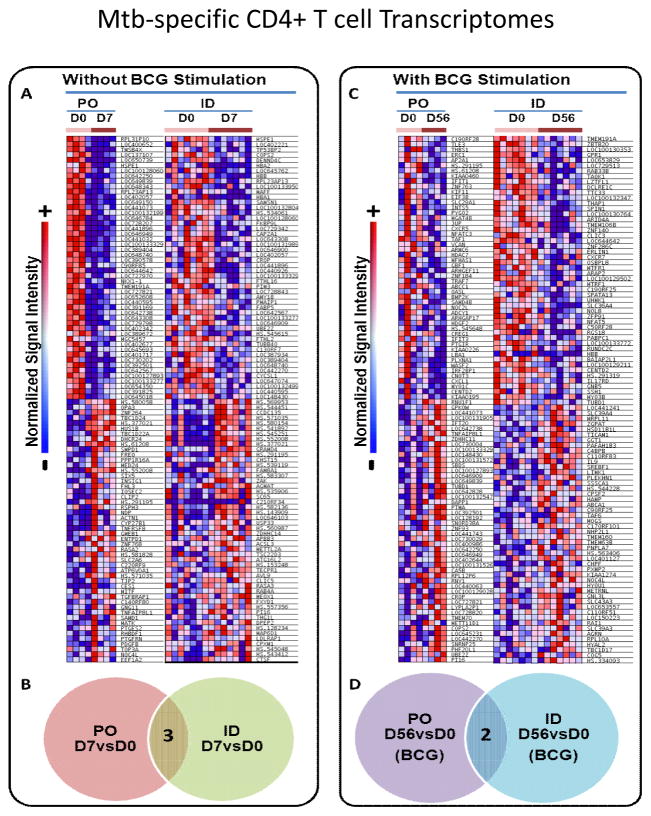
Figure 6. CD4+ T cell transcriptomal differences induced by PO and ID BCG.
Memory CD4+ T cells were purified from PBMC harvested pre-vaccination, 7 days post-vaccination and 56 days post-vaccination from 11 subjects (4 given PO BCG and 7 given ID BCG). Autologous dendritic cells (DC) were generated from blood monocytes and infected or not with BCG. The 3 different serial memory CD4+ T cell populations were cultured for 24 hours with uninfected or BCG-infected DC, and then RNA harvested for Illumina BeadArray transcriptomal analysis. Panel A. shows heat maps for the top 100 altered genes comparing day 7 and day 0 direct ex vivo responses (PO N=4 and ID N=7). Panel B. shows that only 3 of the top altered genes detected at day 7 were the same in PO vs ID BCG recipients. Panel C. shows heat maps for the top altered genes comparing day 56 and day 0 after re-stimulation with BCG-infected DC (PO N=4 and ID N=7). Panel D. shows that only 2 of the top altered genes detected at day 56 were the same in PO vs ID BCG recipients.

