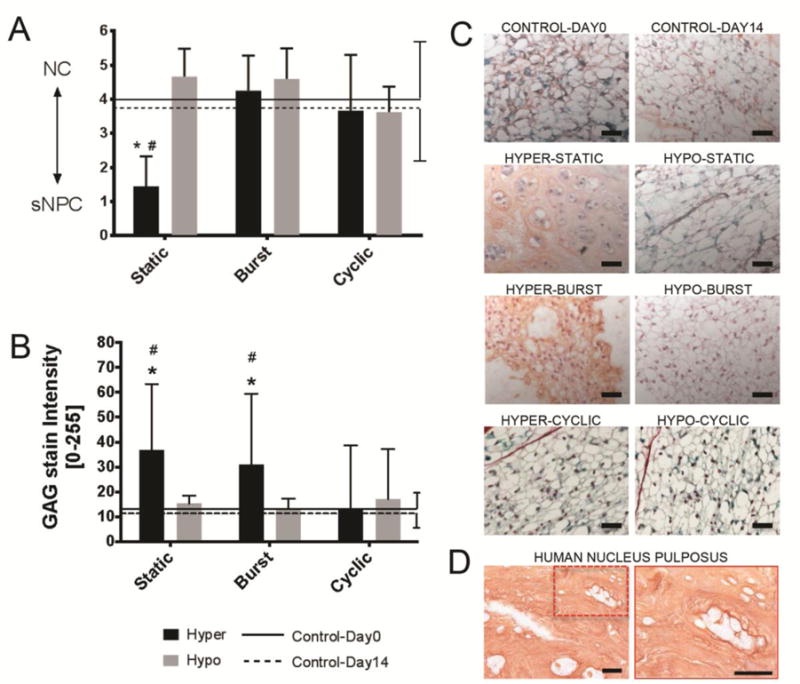
Figure 2. Hyper-Static osmolarity induced NC to sNPC transition and increased GAG staining.

Bar plots (mean ± SD) indicating A) NC to sNPC transition and B) GAG (Saf-O) matrix staining intensity as a function of osmolarity condition and duration with comparisons against Day0 and Day14 control groups. Lower y-axis values indicate a higher proportion of sNPCs. Two-way ANOVA analysis indicated that neither duration nor conditions were significant sources of variation for NC to sNPC transition; moreover, a significant interaction was present between variables (p<0.03). Also, Two-way ANOVA analysis indicated that condition, and not duration, was a significant source of variation for GAG content (p<0.001) without significant interactions. Tukey multiple comparison posthoc test. * = p<0.05 against Control-Day0 and # = p<0.05 against Control-Day14. Presented images are Safranin-O/Light Green (Saf-O/LG) staining depicting the C) mouse and D) human nucleus pulposus region of interest. NP cell morphology was identified with high magnification (40×) images of collagen and GAG staining. NC morphology involved large cell size and presence of vacuoles while sNPC morphology involved small cells size, lack of vacuoles and accumulation of matrix between discrete cells or cell-clusters. Hyper-Static induced NC to sNPC transition with reduced cell size, loss of vacuoles and accumulation of matrix while although all other conditions retained the NC phenotype. Scale bar 50um.
