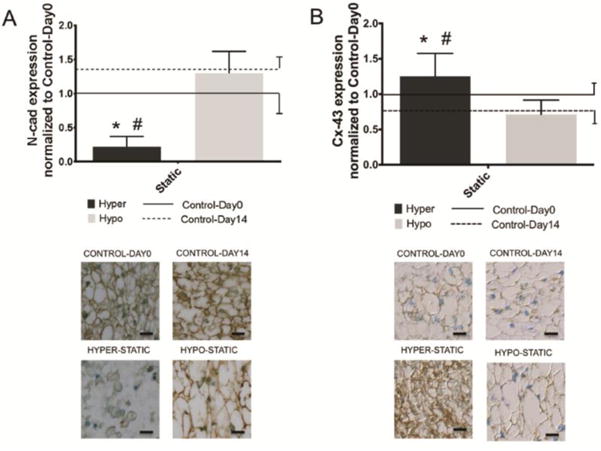
Figure 5. NCs express greater N-cad while sNPCs expressed greater Cx-43.

Bar plots (mean ± SD) for A) N-cad and B) Cx-43 normalized to Control-Day0 as a function of osmolarity condition and duration. Results analyzed for the osmotic loading groups with the largest changes in NP cell morphology. Also indicated are immunostaining representative images of N-cad and Cx-43. N-cad Two-way ANOVA analysis indicated that condition and duration were significant sources of variation (p<0.05) with significant interaction present between variables (P<0.05). Also, Cx-43 Two-way ANOVA analysis indicated that condition, not duration, was significant sources of variation (p<0.05) with significant interaction present between variables (p<0.05). Tukey Posthoc test. * = p<0.05 against Control-Day0 and # = p<0.05 against Control-Day14.
