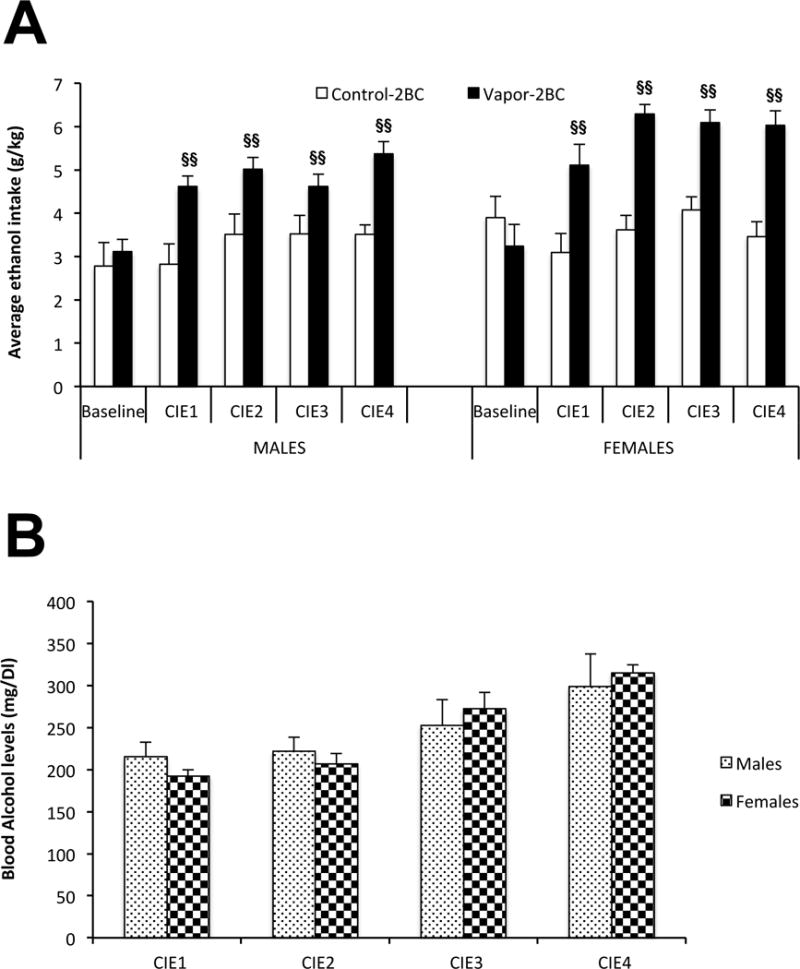
Figure 2.

Escalated EtOH drinking following chronic intermittent EtOH (CIE) [A], and blood alcohol levels during vapor exposure (B). Values (Mean +/− SEM) were compared using a two way ANOVA and Fisher’s PLSD tests. Data are presented separately for males and females; however the post-hoc statistics were performed with sexes combined since there were no significant effects involving sex. Overall, ethanol intake was higher in each CIE test relative to baseline in the vapor-2BC group, with no change over tests in control-2BC mice. §§ p < 0.05 vs. control-2BC with sexes combined.
