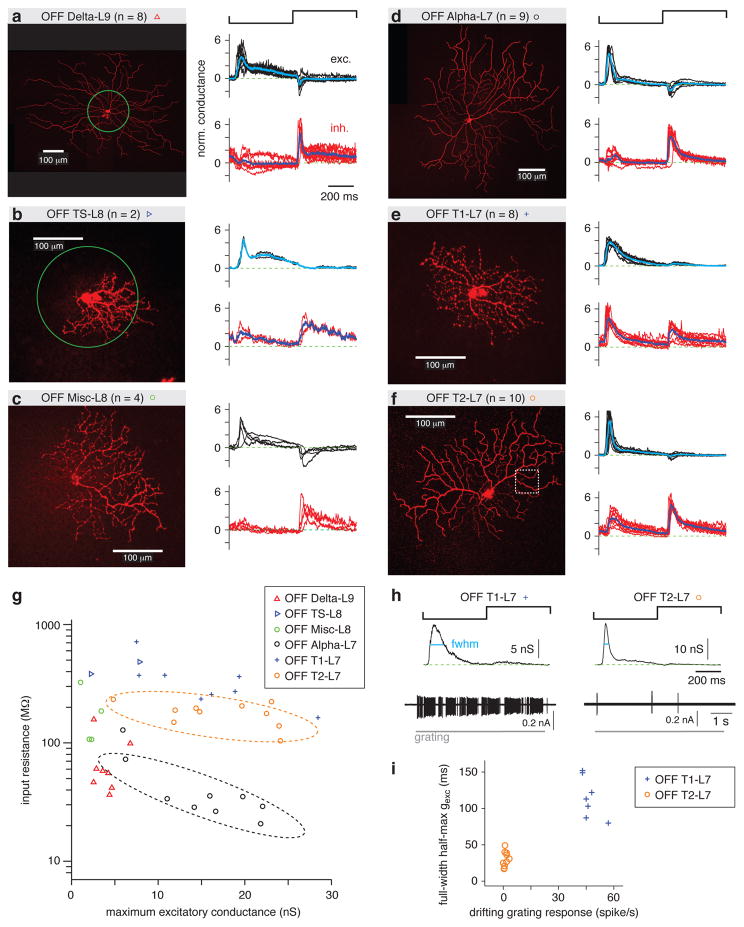
Figure 4. OFF RGC types distinguished by spot response and input resistance.
a. Left, an example OFF Delta-L9 RGC filled with Lucifer Yellow superimposed with a green circle representing the contrast-reversing spot stimulus (0.2-mm diameter, 1 Hz). For the sample of cells (n = 8), the normalized (norm.) excitatory (exc.) and inhibitory (inh.) conductances are shown in black and red, respectively, for each cell. The response was normalized by dividing by the SD of the trace. The average response across cells is shown in cyan (excitatory conductance) or blue (inhibitory conductance).
b. Same format as a. for OFF TS-L8 cells. This cell is shown with the 0.2-mm diameter spot superimposed.
c. Same format as a. for OFF Misc-L8 cells.
d. Same format as a. for OFF Alpha-L7 cells.
e. Same format as a. for OFF T1-L7 cells.
f. Same format as a. for OFF T2-L7 cells. The boxed area indicates the region of interest shown as a side projection in Figure 2a.
g. Input resistance (Rin) plotted against maximum excitatory conductance for OFF cells of all types show in a. – f. Rin distinguished certain cell types. For example, Rin of OFF Alpha-L7 cells (dashed black line) was lower than for OFF T2-L7 cells (dashed orange line), even though their dendrites co-stratified (Figure 2C).
h. Excitatory conductance and spike responses distinguished OFF T1-L7 and OFF T2-L7 RGCs. The full-width at half-maximum (fwhm) of the excitatory conductance was measured during the OFF response (cyan line). The spike rate was measured to the drifting grating stimulus (see Figure 3).
i. OFF T1-L7 cells had a relatively longer fwhm of excitatory conductance (gexc) and a higher firing rate to the grating.

