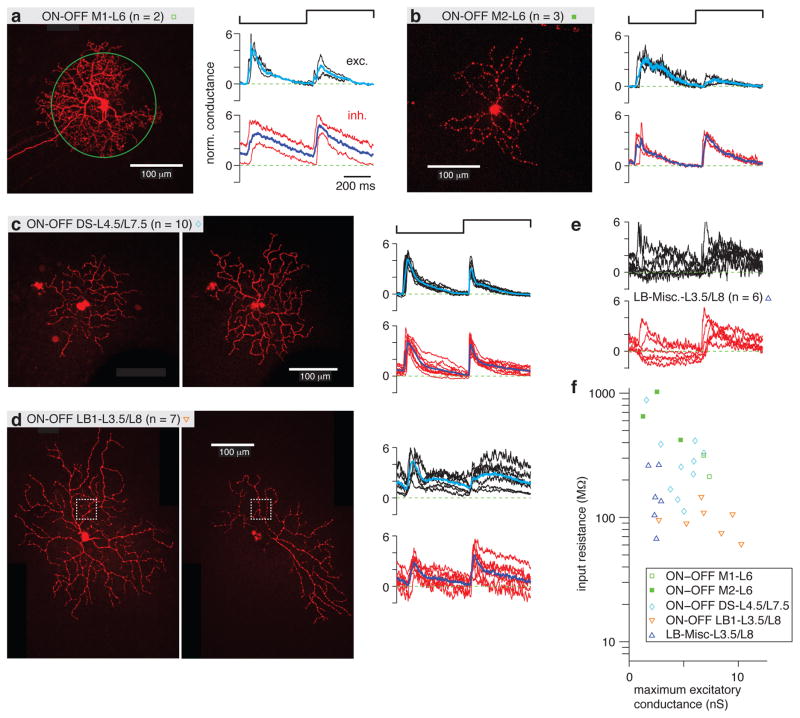
Figure 5. ON-OFF RGC types distinguished by spot response and input resistance.
a. Left, an example ON-OFF M1-L6 RGC filled with Lucifer Yellow superimposed with a green circle representing the contrast-reversing spot stimulus (0.2-mm diameter, 1 Hz). Normalized (norm.) excitatory (exc.) and inhibitory (inh.) conductances are show for each cell, as in Figure 4. The average response across cells is shown in cyan (excitatory conductance) or blue (inhibitory conductance).
b. Same format as a. for ON-OFF M2-L6 cells.
c. Same format as a. for ON-OFF DS-L4.5/L7.5 cells. Both inner (left) and outer (right) dendrites are shown.
d. Same format as c. for ON-OFF LB1-L3.5/L8 cells. The boxed area indicates the region of interest shown as a side projection in Figure 2b.
e. Normalized conductances for a group of miscellaneous large bistratified cells (LB-Misc) that stratified in L3.5 and L8.
f. The Rin for ON-OFF M1-L6 cells was the highest of all groups, whereas the ON-OFF LB1-L3.5/L8 cells had the lowest Rin.

