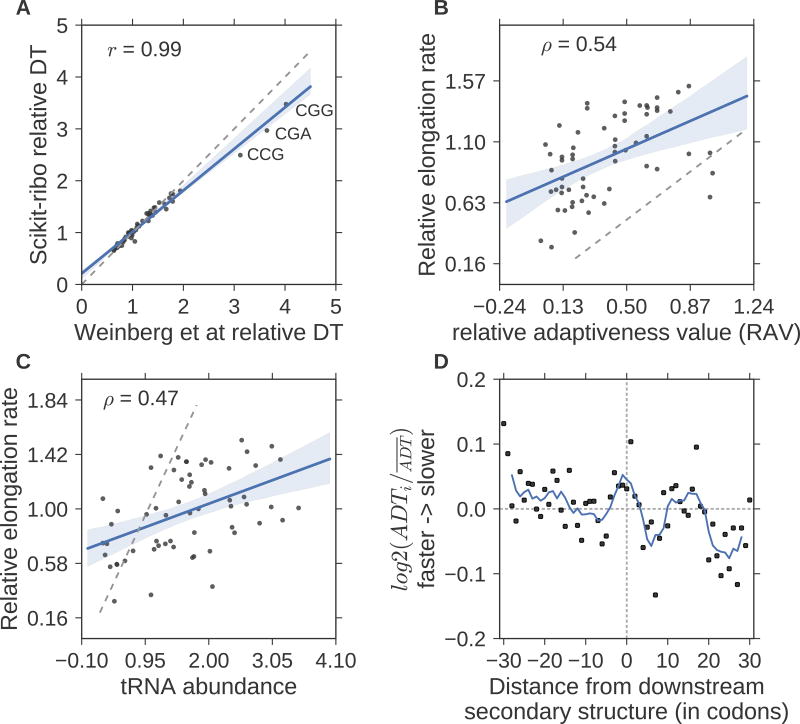
Figure 3. Accurate inference of codon elongation rates and mRNA secondary structure.
(A) Almost perfectly reproduced codon dwell time (DT), inverse of elongation rate) from Weinberg et al (r=0.99). (B) Correlation with the codon’s adaptiveness value (RAV, r=0.5), (C) Correlation with tRNA abundance (r=0.47). In A–C, the gray dashed line denotes the diagonal line; y=x. The RAV scales from 0 to 1. A codon with lower RAV means that it is less optimal for translation elongation, i.e. slower codons. (D) Meta gene analysis of the log ratio of adjusted DT (ADT), divided by the mean adjusted DT. The solid line denotes the average ADT in a five-codon sliding window. A log ratio greater than zero means ribosomes at this position are faster than average. The log ratios on the left were significantly higher than the ones on the right (T-test, p-value= 5 × 10⁻³). The unit of the distance is codon.

