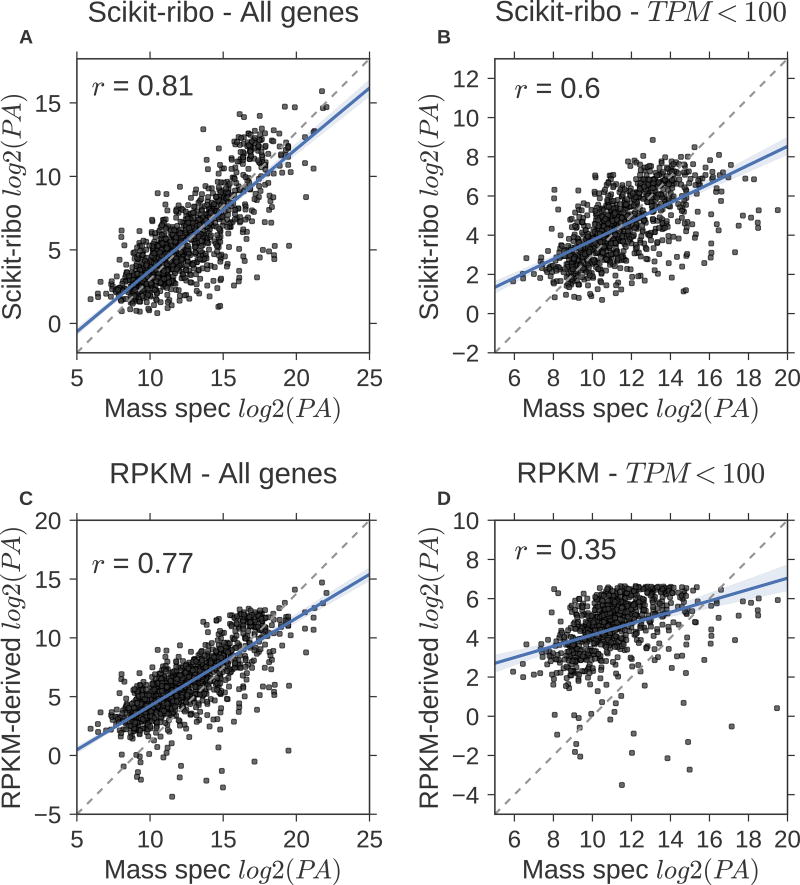
Figure 5. Large-scale validation with mass spectrometry data confirmed Scikit-ribo’s accurate TE estimates, especially for low-abundance genes.
(A) Scikit-ribo derived protein abundance (PA) for all genes in the validation set (r = 0.81, β = 0.83). (B) Scikit-ribo derived PA for genes with TPM less than 100 (r = 0.6, β = 0.48). (C) RPKM-derived PA for all genes in the validation set (r = 0.77, β = 0.75). (D) RPKM-derived PA for genes with TPM less than 100 (r = 0.35, β = 0.29). The black dashed line denotes the identity line; y=x.

