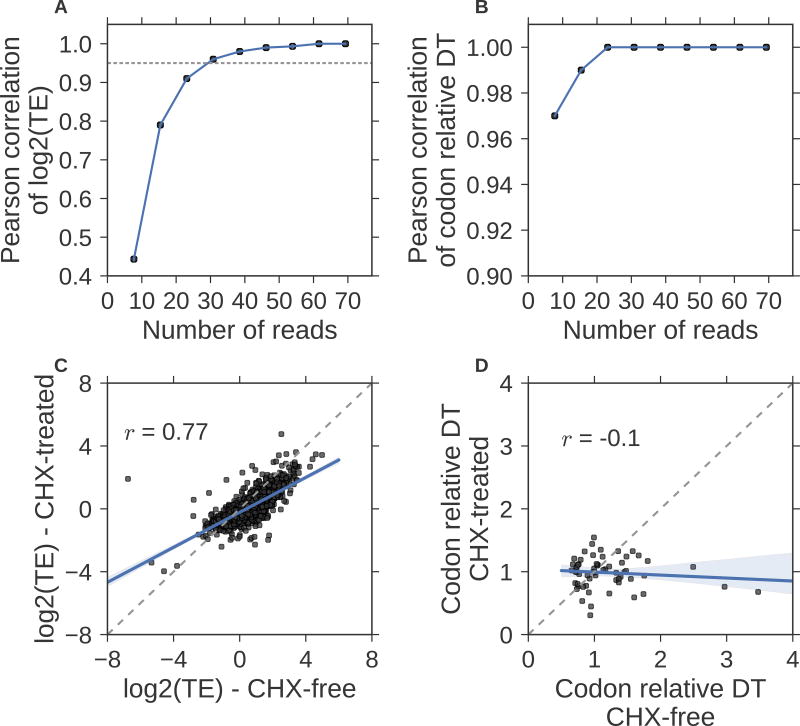
Figure 6. Practical considerations of using Scikit-ribo for Riboseq analysis.
Pearson correlations between the down-sampled data and the original data (Weinberg et al) on (A) log2(TE), the gray dashed horizontal line denotes Pearson r = 0.95. (B) The same down-sampling comparison for the codon relative dwell time (DT). (C) Scatter plot of log2 TE on Riboseq experiments treated with cycloheximide (CHX) and CHX free data, (D) Same comparison for the codon relative dwell time (DT). The CHX free data is from Weinberg et al, and the CHX-treated Riboseq data is from McManus et al. Both data are in S. cerevisiae. The black dashed line denotes the identity line; y=x.

