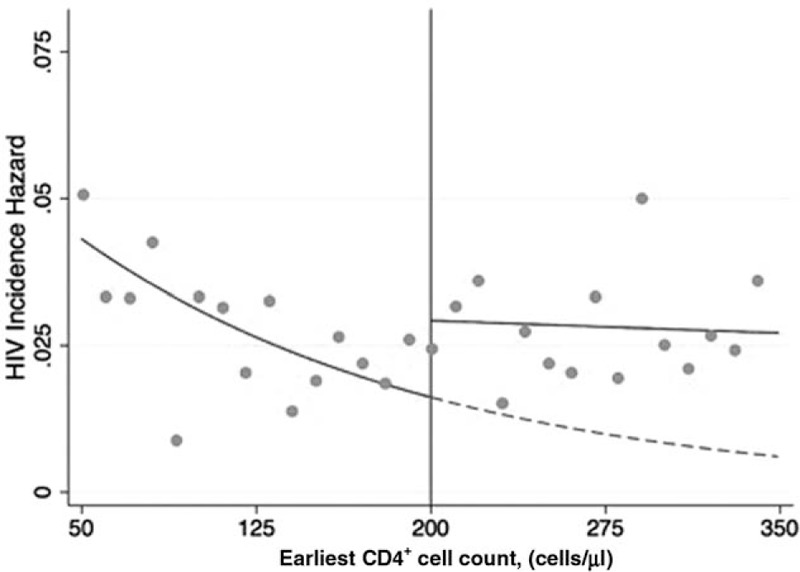
Fig. 3.
HIV incidence by baseline CD4+ cell count.

HIV incidence in HIV-uninfected household members by the baseline CD4+ cell count of the first HIV-infected member of their household to link to HIV care. Orange dots indicate the raw HIV incidence for each 10 cell/μl bin. Green lines indicate fitted regression lines estimating the incidence of HIV as a function of earliest CD4+ cell count above and below the threshold (red line). The dotted green line is the projection for the curve below the threshold, which is the estimate of what HIV incidence for individuals above the threshold (who are not eligible for immediate antiretroviral therapy initiation) would have been, if they had actually been eligible for antiretroviral therapy immediately. The discontinuity at the threshold is the estimate of the effect of antiretroviral therapy eligibility on incidence.
