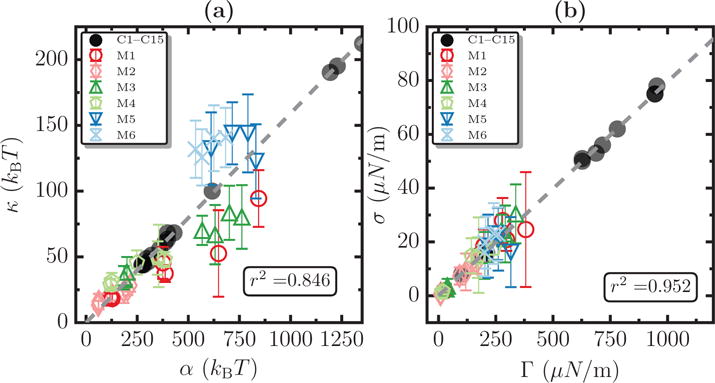
Figure 10.

Validity of the scaling relations for κ and σ for data from simulations (M1–M6, shown as open symbols) and experiments (C1–C15, shown as filled symbols). Panel (a) shows the relation κ/α = 1/2π and panel (b) shows the scaling relation σ/Γ = 1/4π, and the corresponding correlation coefficients for systems M1-M6 are found to be r2 = 0.846 and r2 = 0.952, respectively. The dotted lines in panels (a) and (b) correspond to 1/2π and 1/4π respectively.
