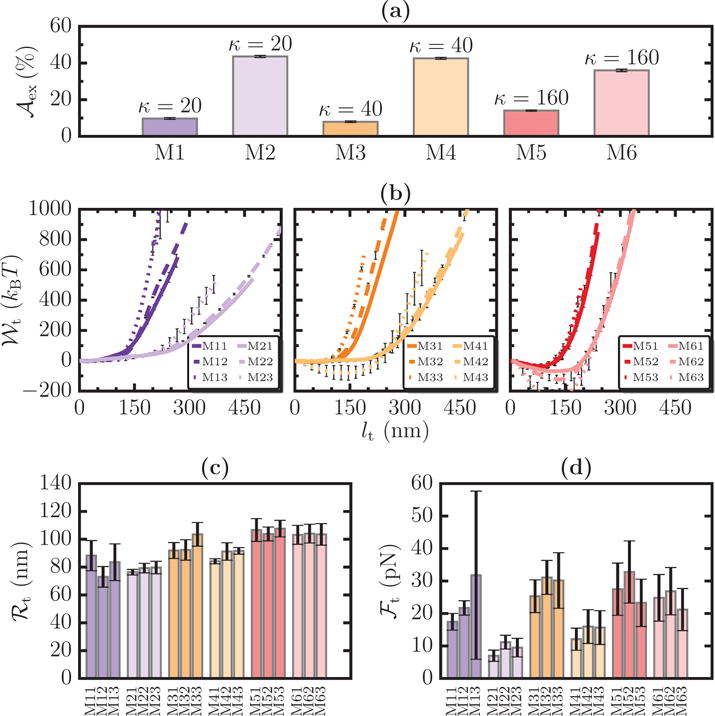
Figure 9.

(a) Six model membrane systems, denoted M1–M6, with specified values of and κ. For any system Mi (i = 1 ⋯ 6), Mi1, Mi2, and Mi3 correspond to tethers extracted with ℛbead = 25, 50, and 75 nm, respectively. The values of , ℱt, and ℛt for all the systems are shown in panels (b), (c), and (d), respectively.
