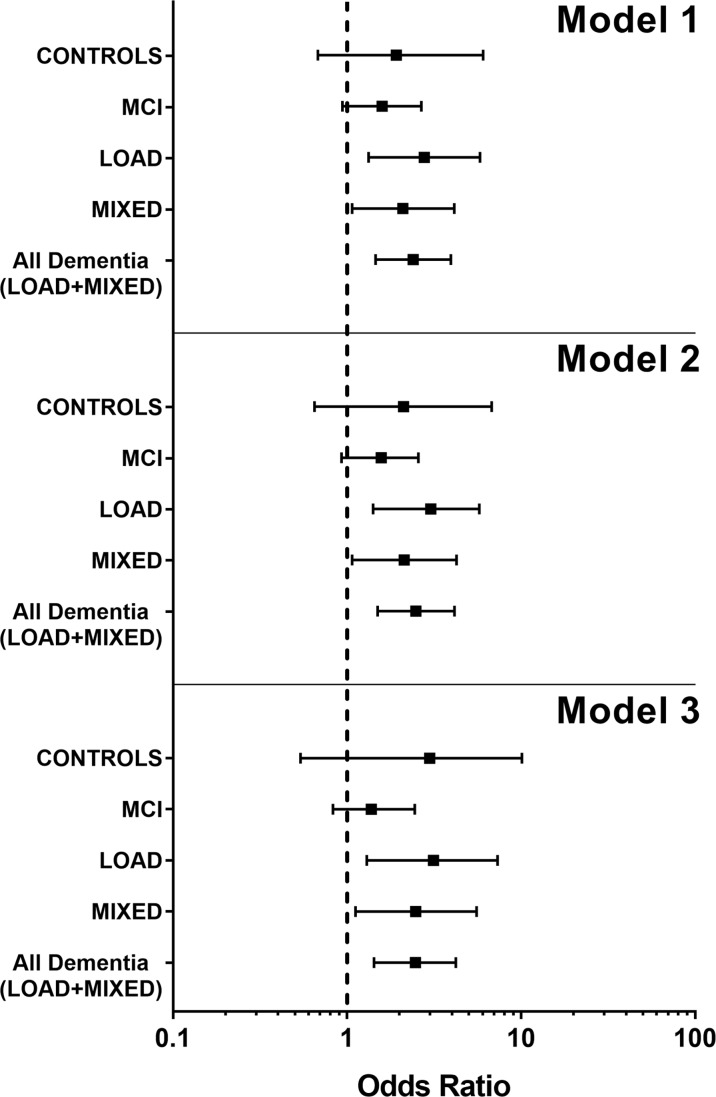
Fig. 1.
Forest plot showing the ODDS ratio as a measure of association between BADL decline (≥ 1 lost BADLs) and hs-CRP in the considered groups of subjects. Model 1 represents the unadjusted model, Model 2 the model adjusted for age and gender, and Model 3 represents the model adjusted for all covariates and possible confounding factors (see Table 2 for reference). As can be seen, in all the three models, the decline in BADL activities was significantly associated with inflammation only in the LOAD, MIXED, and All Dementia groups, with the LOAD group showing the greater association. The ODDS ratio is represented by the square in the center; the horizontal bar shows the range of ODDS ratio

