
Fig. 5.
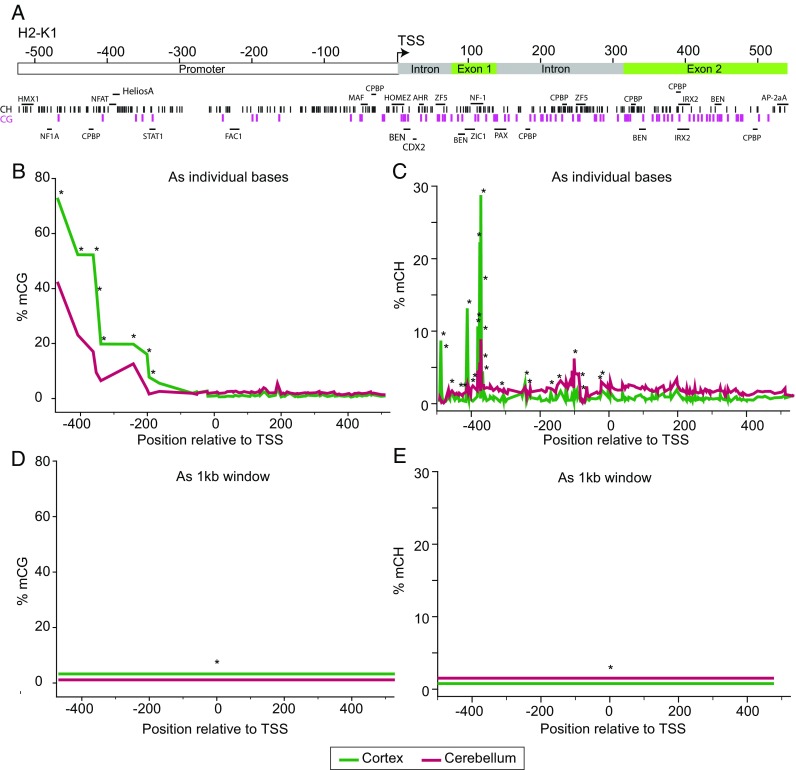
Base-specific versus region-based quantitation. For computational simplicity, methylation analysis is sometimes performed as regions. This signal compression comes with distinct disadvantages. a In this example from Mangold et al. (2017a), a region ± 500 bp of the mouse H2-K1 promoter containing a number of genomic features (promoter, intron, exon, and transcription factor sites) and CG (purple tics) and CH sites (black, tics) was examined by BSAS. CG (b) and CH (c) methylation demonstrated distinct, base-specific, profiles across the region examined. Differences in methylation levels between the cerebral cortex and cerebellum were found at a number of sites (*p < 0.05, t test, B-H MTC, n = 8/group). If these values are compressed into a region analysis across the 1 kb, differences are still evident in CG (d) and CH (e) methylation but the magnitude of differences are compressed and the specificity for the differentially methylated sites to genomic features is lost