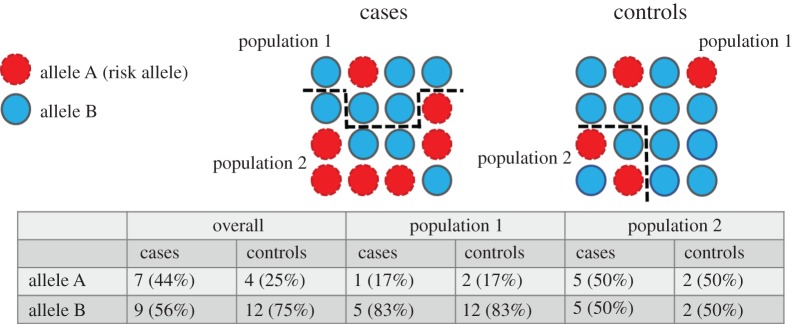
Figure 1.
Population stratification. When looking at the sample overall, there is a higher frequency of risk allele A in cases than controls. However, there are two ‘hidden populations’ within this sample and the risk allele has a higher frequency in one population than the other. Cases and controls are sampled disproportionately, resulting in a false positive association for this variant. (Online version in colour.)

