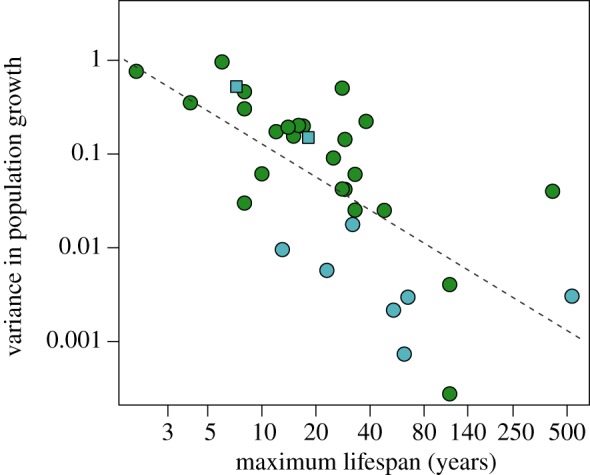
Figure 3.

Relationship between temporal variability in population growth and maximum longevity in terrestrial plants (green, n = 25, Spearman's ρ =−0.68; p = 0.0002) and marine sessile (light blue, n = 9; Spearman's ρ =−0.67, p = 0.0214) species, and overall (n = 34; Spearman's ρ =−0.73; p < 0.0001). Squared light blue dots correspond to two bivalve species whose variance was computed directly from observed annual lambdas. (Online version in colour.)
