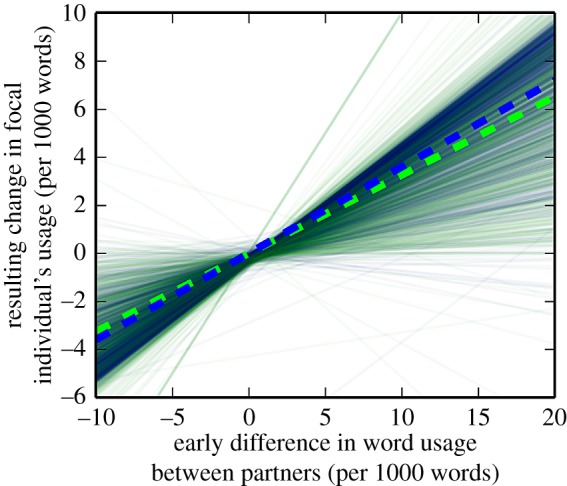
Figure 2.

Word heritability between conversing partners is greater than that for non-conversing partners. For each test word, we plot regressions (see Methods) for data from conversing partners (blue solid lines) and non-conversing partners (green solid lines). The regression lines were superimposed by translucently plotting lines for each regression, interleaving between the two datasets. We found relatively high levels of word heritability in non-conversing partners due to word usage changing at population levels. A Mann–Witney U-test indicated that the slopes for conversing partners tend to be steeper than those for non-conversing partners (pMW < 9.5 × 10⁻¹⁰). The two dashed lines (same colours) are slopes regressed over data collected for all of the words; the difference between these values was W = 0.0340, which is a measurement of word heritability due to Twitter conversations. We tested that W > 0 using a bootstrap (pB < 0.001, see Methods).
