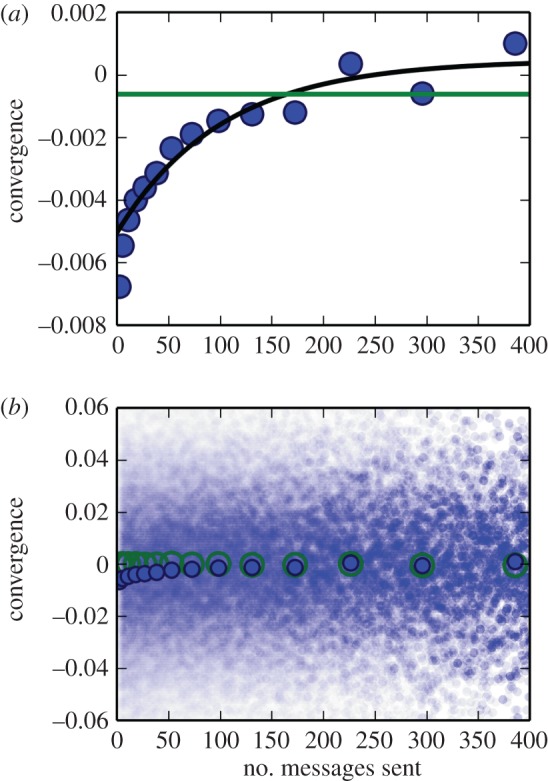
Figure 4.

The more messages were sent between two users, the more their language converged. (a) Plot of the means of bins of conversation pairs (binned along the x-axis showing x, y means of each bin) and fitted models (black line is the transmission model, green horizontal line is the null model; see Methods). The fitted line of our model crosses zero at approximately 310 messages sent. (b) Illustration of the large variance in the data (unbordered translucent circles which are superimposed). The convergence of 500 conversation pairs (sampled with replacement) are plotted per bin on the x-axis (bordered blue circles). Control values are also shown (bordered green circles).
