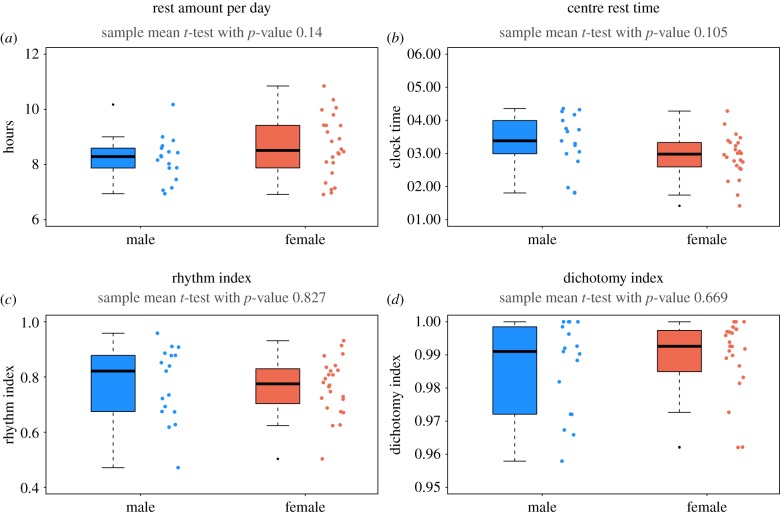
Figure 10.
Checking for sex specific effects: boxplots of amount of rest per day (a), centre of rest (b), RI (c) and dichotomy index I < O (d) for all individuals (excluding outliers) grouped into male (blue) and female (red). The single estimated values for each individual are plotted alongside the boxplot to better show the distribution. Results of t-tests for equality of mean between the two groups are reported on top of the graph. There is no significant evidence in this sample in favour of a sex-specific effect in these parameters although we note that the lower p-values in the panels (a,b) suggest that a significant sex-specific effect might emerge for a larger sample size.

