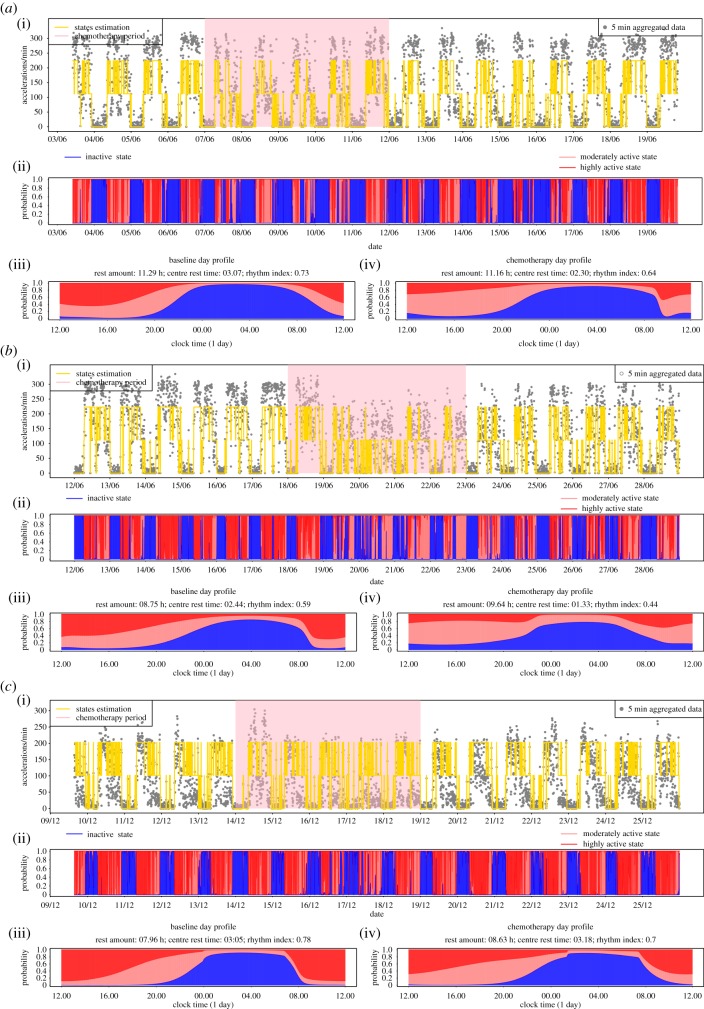
Figure 11.
Data and Results for fitting circadian harmonic HMM for three cancer patients (a-b). Coefficients for the circadian transition probabilities are assumed to be shifted during chemotherapy as in equation (5). For each patient: (a(i)–c(i)) time series of activity with yellow line indicating the mostly likely state using local decoding. The highlighted pink section indicates when the chemotherapy was administered. (a(ii)–c(ii)) SP plot. (c) Circadian profile of state probabilities during non-chemo time (a(iii)–c(iii)) and chemo time (a(iv)–c(iv)). The estimated values for rest amount, centre of rest and RI are stated in the heading of each panel.

