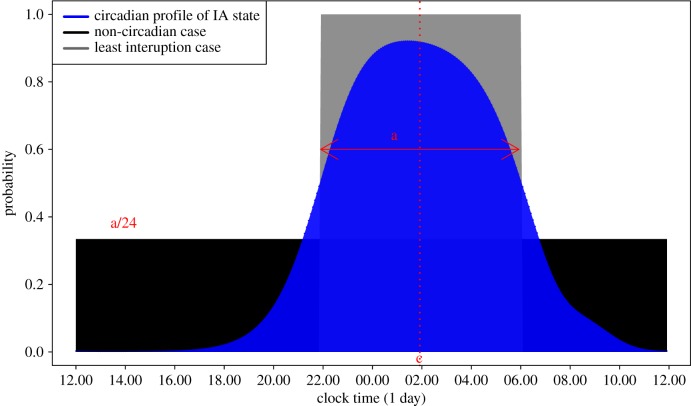
Figure 8.
Diagram for deriving rhythm index RI. Blue area gives the probability of IA state as in previous plot for a subject with an amount of rest a = 8 h (equal to the size of the blue area) centred at c = 02.00. The grey rectangular area corresponds to the probability of IA state under a perfectly regular circadian rhythm of rest for which the RI assumes a value of 1. The black rectangular area corresponds to probability of IA state in the absence of any circadian rhythm with an RI value of 0. Note that the size of the grey and black areas (they are both over-plotted by blue) correspond to a total rest time of 8 h.

