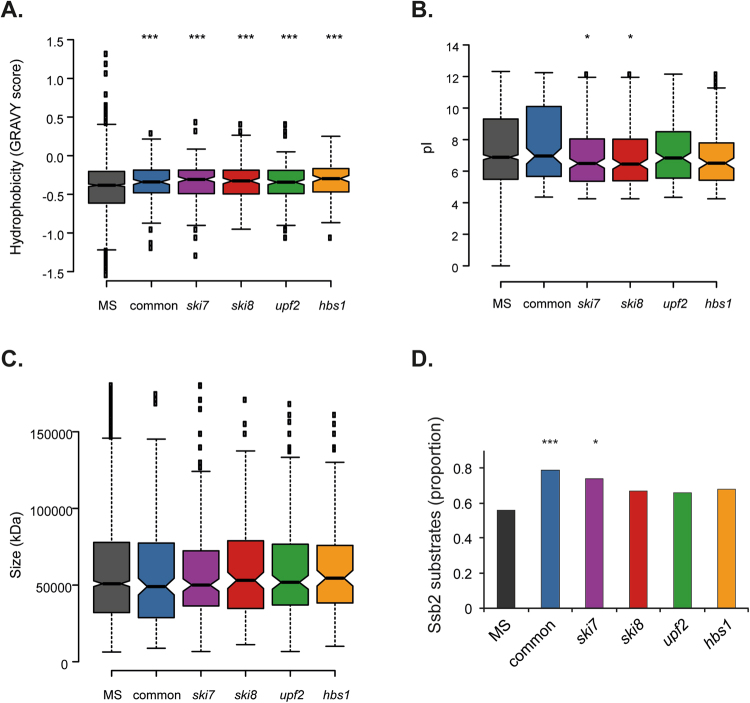
Figure 5.
Analysis of physicochemical properties of aggregated proteins. (A) Comparison of the grand average of hydrophobicity (GRAVY) scores as a measure of hydrophobicity. (B) Comparison of Isoelectric points (pI). (C) Comparison of protein size (kDa). Mann–Whiney U-tests were used to assess the statistical significance of observed differences: *p < 0.05, ***p < 0.005. (D) Comparison with proteins that are co-translational substrates of Ssb232.

