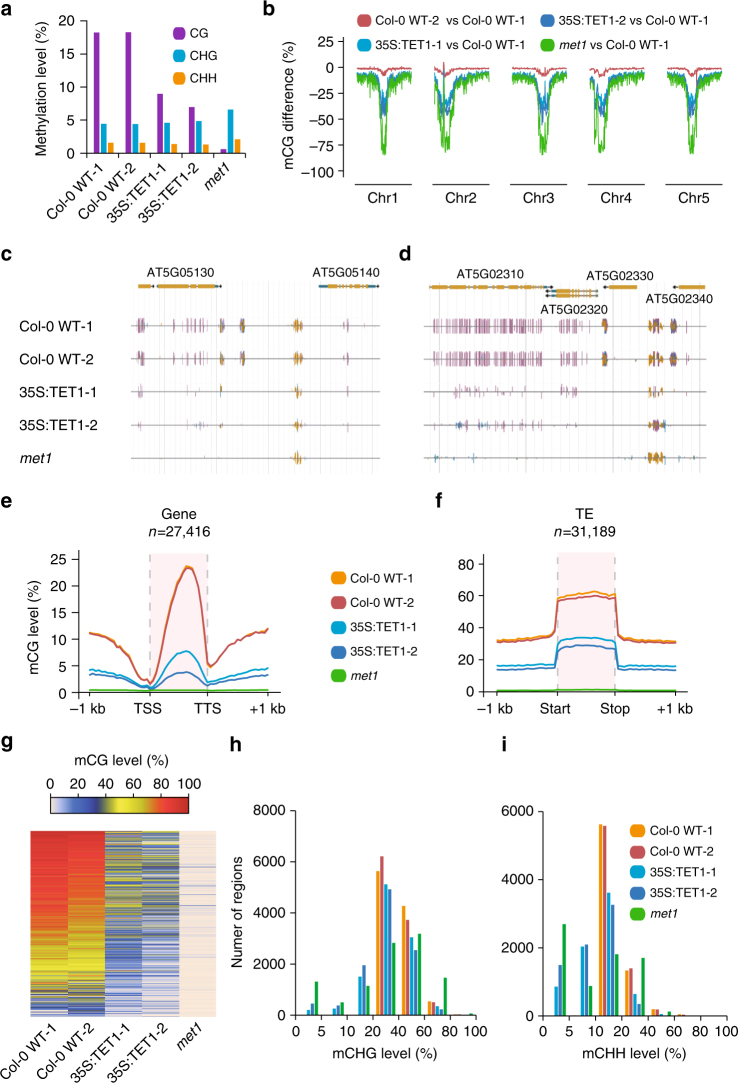
Fig. 1.
Overexpression of hTET1cd-induced global CG demethylation in A. thaliana. a Bar graph of global methylation levels in two Col-0 WT replicates, two 35S:TET1 transgenic individuals, and met1. b Metaplot of CG methylation levels (100 kb windows) across five A. thaliana chromosomes. Methylation level differences were defined relative to Col-0 WT-1, and Col-0 WT-2 was used to assess background interference. Genome browser view of methylome profile of two regions (c, d) of the A. thaliana genome (purple vertical lines = CG methylation, blue vertical lines = CHG methylation, and gold vertical lines = CHH methylation). Metagene plots of CG methylation level across e gene bodies and f transposable elements. g Heat map of CG methylation level of CG DMRs. Bar plots of CHG (h) and CHH (i) methylation levels of CG DMRs that possess non-CG methylation in wild-type individuals

