Fig. 3.

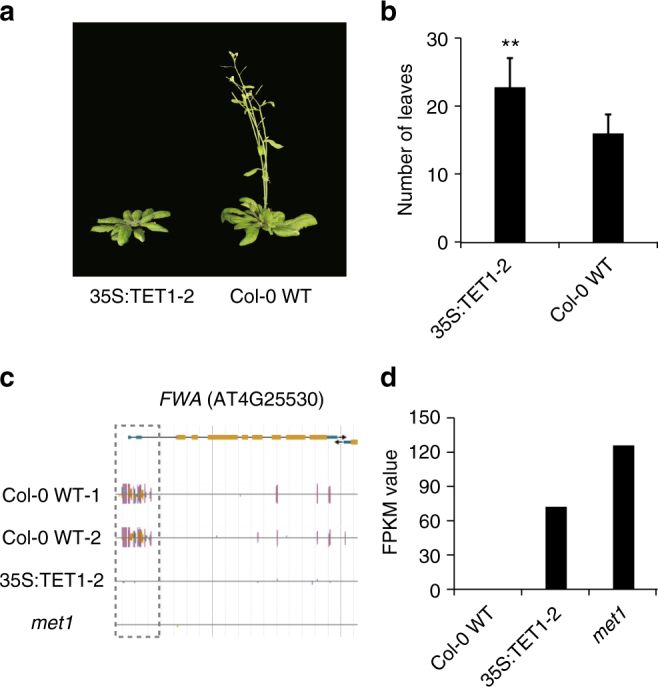
35S:TET1 plants have a delayed flowering phenotype. a Photographs of one 35S:TET1-2 transgenic plant and Col-0 WT plant and b corresponding number of rosette leaves. Error bars indicate s.d. (**t-test, p value <0.01). c Genome browser view of FWA (AT4G25530). Both CG and non-CG DNA methylation are depleted from the 5′UTR in 35S:TET1-2 plants (purple vertical lines = CG methylation, blue vertical lines = CHG methylation, and gold vertical lines = CHH methylation). d Expression level (FPKM) of FWA
