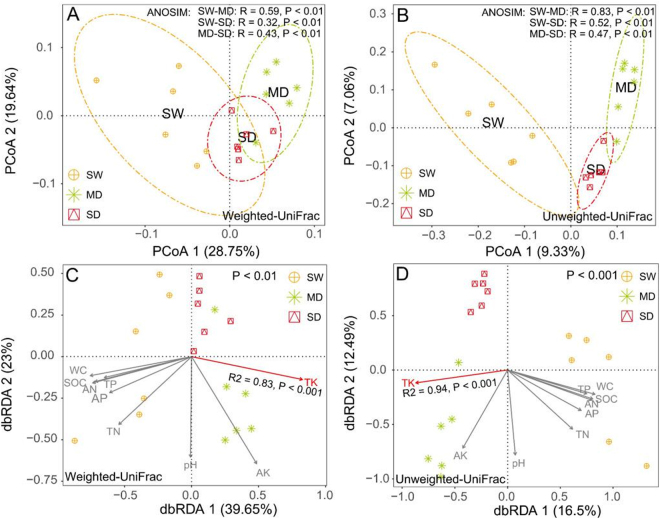
Figure 3.
Microbial community variation across the Zoige plateau wetland soils. (A,B) Principal coordinate analysis (PCoA) plots of OTU-based weighted (A) and unweighted (B) UniFrac distances between samples; (C,D) distance-based redundancy analysis (dbRDA) of weighted (C) and unweighted (D) UniFrac distances quantifying the impacts of edaphic factors on microbial community composition. SW: swamp soil; MD: meadow soil; and SD: sandy soil. WC: water content; SOC: soil organic carbon; TN: total nitrogen; TP: total phosphorus; TK: total potassium; AN: available nitrogen; OP: Olsen phosphorus (available phosphorus); AK: available potassium. PDA: Potential denitrifying activity. *SW: swamp soil; MD: meadow soil; SD: sandy soil.

