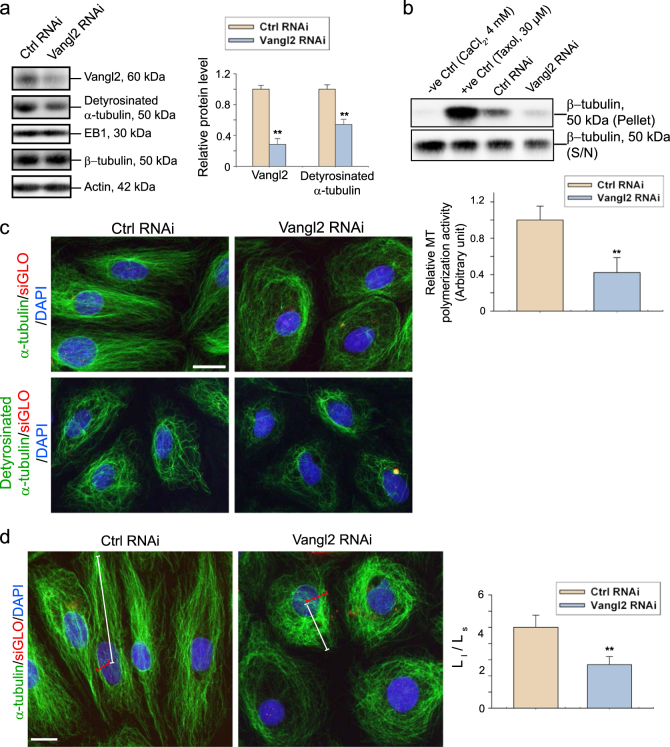
Fig. 5. Knockdown of Vangl2 in vitro perturbs MT organization in Sertoli cells through changes in MT polymerization activity.
a Knockdown of Vangl2 by RNAi using specific Vangl2 siRNA duplexes (Vangl2 RNAi) vs. the non-targeting control siRNA duplexes (Ctrl RNAi) was assessed by immunoblotting wherein the expression of Vangl2 was reduced by ~70%, but also reducing the expression of detyrosinated α-tubulin by ~40% (note: detyrosinated α-tubulin is known to confer MT stabilization, making MT less dynamic). However, the expression of EB1, a +TIP protein known to stabilize MTs, did not alter, with ß-tubulin and ß-actin served as the protein loading control. Some data shown in the left panel were summarized in the bar graph and shown on the right. Each bar is a mean ± SD of n = 3 independent experiments. **P<0.01 by Student’s t-test. b MT spin-down assay was performed using lysates of Sertoli cells transfected with either non-targeting negative control or Vangl2 siRNA duplexes to assess the relative level of polymerized MTs in Sertoli cells following Vangl2 knockdown. Sertoli cells treated with CaCl2 (4 mM) and Taxol (30 µM) served as the corresponding negative and positive control, in which CaCl2 is known to promote MT depolymerization whereas Taxol is a MT stabilizing reagent. A considerable decline in the β-tubulin (note: α- and ß-tubulin serve as the building blocks of MT) level following Vangl2 knockdown in the pellet illustrates that Vangl2 is involved in promoting MT polymerization and/or MT stabilization. The histogram below summarizes results of immunoblot analysis such as those shown above with each bar represents a mean ± SD of n = 3 independent experiments using different batches of Sertoli cells. **P<0.01 by Student’s t-test compared to control. c IF analysis was performed using Sertoli cells transfected with either non-targeting control or Vangl2 siRNA duplexes wherein considerable changes in MT organization were detected in Vangl2 silenced cells by α-tubulin staining. For instance, MTs no longer stretched across the entire Sertoli cell cytosol but retracted from cell periphery, moving closer to encircle the cell nucleus. A considerable down-regulation of the fluorescent intensity of detyrosinated a-tubulin following Vangl2 knockdown was observed, consistent with findings shown in (a). Successful transfection was indicated by DY-547-siGLO (red fluorescence; Dharmacon-GE Healthcare) which was used for co-transfection with siRNA duplexes. Scale bar, 25 µm, which applies to other micrographs. d Changes in MT organization in Sertoli cells following Vangl2 knockdown was quantified by comparing the longest distance of MT visualized by α-tubulin staining from the cell periphery to the nucleus (Ll) with the shortest one (Ls) in 70 randomly selected cells from an experiment. Scale bar=20 µm, which applies to other micrographs. A statistically significant difference in the ratio from the Vangl2 knockdown cells vs. control cells was noted in the histogram shown on the right panel. Each bar is a mean ± SD of n = 3 experiments using different batches of Sertoli cells. **P<0.01 by Student’s t-test

