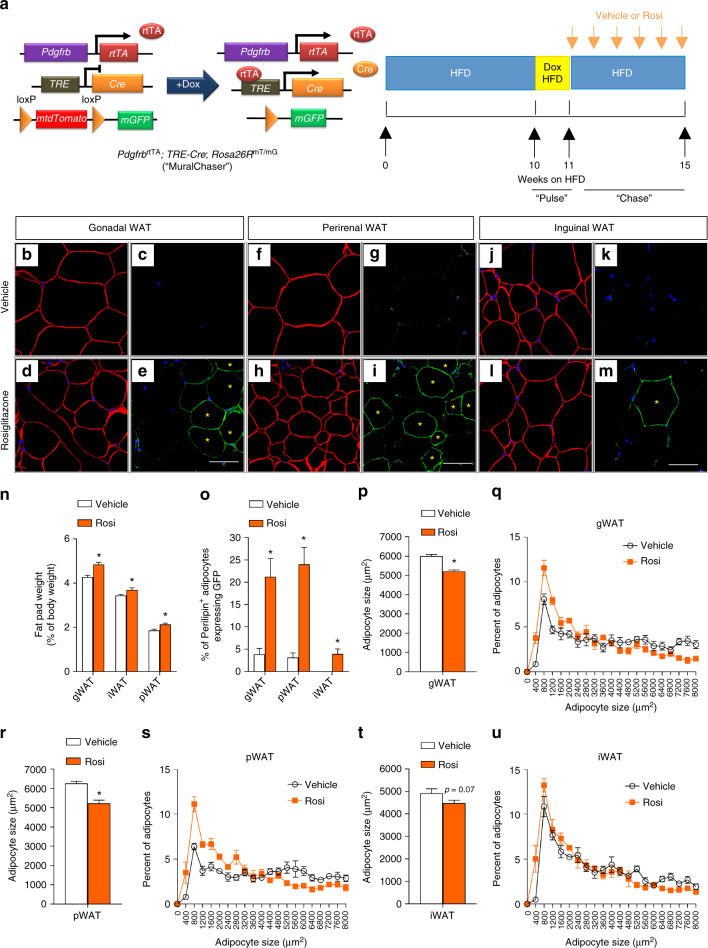
Fig. 5.
Pdgfrβ+ precursors contribute to rosiglitazone-induced adipocyte hyperplasia. a MuralChaser mice were fed on standard chow diet until 6 weeks old before being switched to HFD for 10 weeks. Mice were then administrated with dox-containing HFD (600 mg/kg) for 7 days (“pulse”). Following the pulse-labeling period, mice were switched back to regular HFD for another 4 weeks during which vehicle (1% methylcellulose) or rosiglitazone (Rosi) (10 mg/kg/day) was delivered by gavage (“chase”). Paraffin sections of WAT from these animals were stained with anti-GFP (green) and anti-perilipin (red), then counterstained with DAPI (blue; nuclei). b–e Representative ×63 magnification confocal immunofluorescence images of gonadal WAT sections after rosiglitazone treatment (“chase”). * indicates GFP-labeled perilipin-positive cells. Scale bar, 50 μm. f–i Representative ×63 magnification confocal immunofluorescence images of perirenal WAT sections after rosiglitazone treatment (“chase”). * indicates GFP-labeled perilipin-positive cells. Scale bar, 50 μm. j–m Representative ×63 magnification confocal immunofluorescence images of inguinal WAT sections after rosiglitazone treatment (“chase”). * indicates GFP-labeled perilipin-positive cells. Scale bar, 50 μm. n Fat pad weight (normalized to body weight) of the indicated fat depots of mice treated with vehicle or rosiglitazone. Student’s t-test, *p < 0.05; n = 6 per group. Bars/data points represent mean + s.e.m. o Percentage of perilipin-positive adipocytes expressing GFP in the indicated fat depots of mice treated with vehicle or rosiglitazone. Welch’s t-test, *p < 0.05; n = 12 randomly chosen ×63 magnification fields from three individual reporter animals. Bars/data points represent mean + s.e.m. p Average adipocyte size and q distribution of adipocyte size in gonadal WAT from mice treated with vehicle or rosiglitazone. Student’s t-test, *p < 0.05; n = 6 per group. Bars/data points represent mean + s.e.m. r Average adipocyte size and s distribution of adipocyte size in perirenal WAT from mice treated with vehicle or rosiglitazone. Student’s t-test, *p < 0.05; n = 6 per group. Bars/data points represent mean + s.e.m. t Average adipocyte size and u distribution of adipocyte size in inguinal WAT from mice treated with vehicle or rosiglitazone. n = 6 per group. Bars/data points represent mean + s.e.m.

