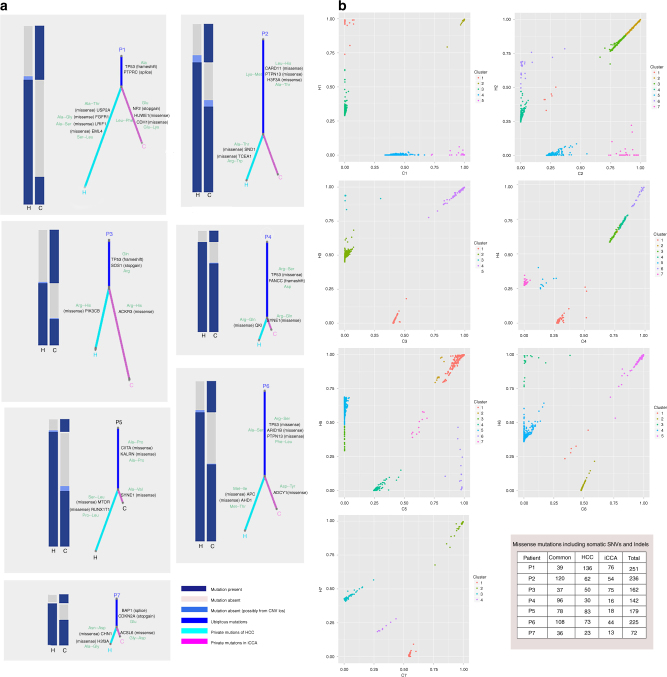
Fig. 5.
Missense mutations and cancer cell fraction comparisons within each H-ChC. a Heatplot with different bars represents various distributions of missense mutations including somatic SNVs and Indels within H-ChC. Fraction of ubiquitous nonsynonymous somatic mutations (trunk) (blue bar) and unique nonsynonymous somatic mutations (branch) (green bar for HCC and pink bar for iCCA) reveal the relationship of two tumor samples within a single H-ChC. Part of driver mutations was marked on trunk and branch of evolutionary trees. b Two-dimensional scatter plots show the cancer cell fraction (CCF) of the mutations in HCC and iCCA components of tumors. Different clusters were calculated from each H-ChC sample. Clusters off the axes indicate mutations in both of tumor components. Clusters on the axes reveal mutations in either HCC or iCCA components. c The table shows missense mutations in different tumor components

