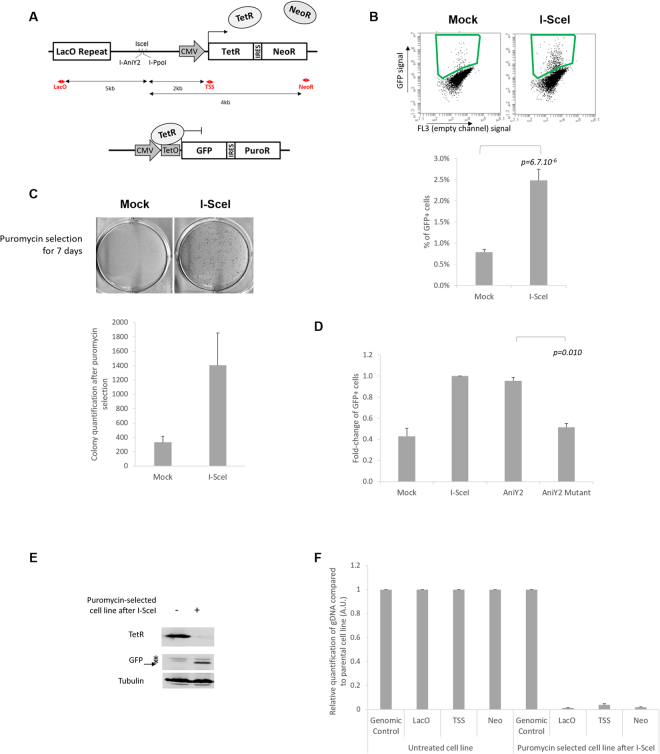
Figure 1.
Two-component system to study large deletions following a DSB: (A) Schematic representation of the cell line, named U2OS-RE-TetR-GFP. Two components have been stably integrated in the U2OS cell line: the first (top panel) is composed of LacO repeats, an array with specific RE sites for I-SceI, I-PpoI and I-AniY2, and a TetR-IRES-NeoR gene under control of a CMV promotor; the second component (bottom panel) is a bicistronic GFP-IRES-PuroR cassette under the control of two TetO sites. The red arrows indicate the location of the primers used in F, and the black arrows the distance to the RE array. (B) Flow cytometry analysis of the GFP-positive subpopulation seven days after I-SceI induction. Top panel: representative dot plots of FACS analysis seven days after I-SceI induction in I-SceI-transfected or in control cells (Mock). The green square indicates the gate used to quantify the percentage of positive cells. Bottom panel: quantification of the percentage of GFP-positive cells seven day after I-SceI induction (n = 11 for a single U2OS-RE-TetR-GFP clone (mc#5). (C) Clonogenicity assay: 3 days after I-SceI induction cells were treated with puromycin for one week, then fixed and stained with brilliant blue (top panel). Bottom panel: ImageJ quantification of colony numbers (n = 3). (D) The loss of TetR expression is dependent on DSB: fold-change of GFP-positive cells induced by different RE, as indicated (I-SceI, I-AniY2 wt and the nickase mutant I-AniY2-K227M) normalised to I-SceI (n = 3). (E) Immunoblot analysis of a polyclonal cell line selected by puromycin treatment following I-SceI induction, with specific antibodies directed against TetR, GFP and tubulin (as a loading control). (F) Relative quantification of genomic DNA in 3 independently established puromycin-selected cell lines evaluated by qPCR using specific primers localized around the break site (as indicated in A), compared to a genomic control region (Genomic control #1) and normalized to the signal from untreated cells (n = 3). All p-values are from two-tailed, paired T-tests. All error bars represent the standard error of the mean, unless stated otherwise.

