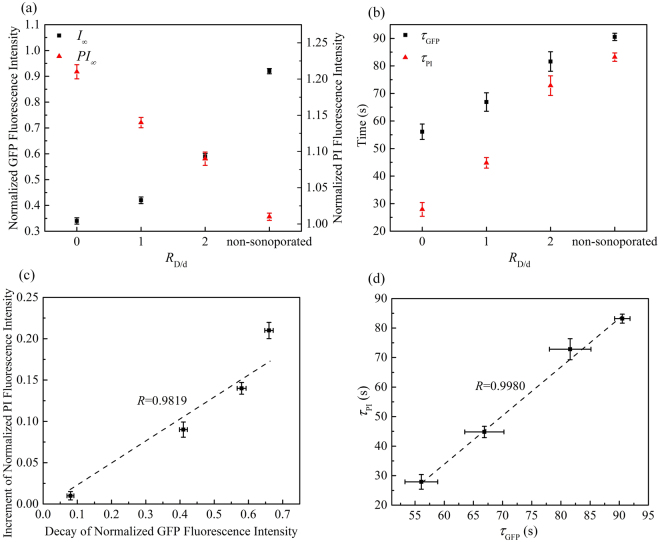
Figure 6.
Quantitatively analyses of α-tubulin cytoskeleton arrangement and PI uptake induced by sonoporation with different microbubble-cell parameters RD/d and constant p− = 0.4 MPa: (a) The values of asymptotic fluorescence intensity; (b) the values of characteristic decay time and recovery time; (c) a correlation plot showing the relationship between increment of PI fluorescence intensity and decay of GFP fluorescence intensity; and (d) a correlation plot showing the relationship between τPI and τGFP . Linear correlation coefficients are also indicated.

