Figure 1.
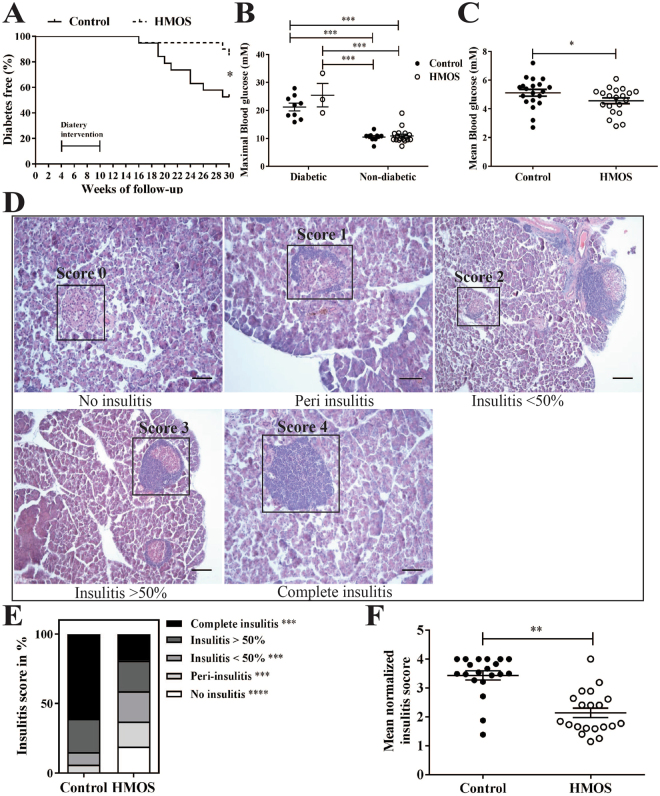
Early HMOS dietary intervention protects NOD-mice from onset and development of T1D. (A) Diabetes Free percentage in control (solid line trace, n = 19) and HMOS (dash line trace, n = 20) group over time. (B) Maximal measured blood glucose levels (mM) in control (black dots, n = 9 for diabetic and n = 11 for non-diabetic) and HMOS group (white dots, n = 3 for diabetic and n = 17 for non-diabetic) were grouped according to diabetic or non-diabetic status. (C) Mean Blood glucose (mM) of control (black dots, n = 19) and HMOS group (white dots, n = 20). (D) Degree of insulitis as scored on representative HE stained islets (range 0–4). Scale bars: 50 μm. (E) Average percentage of each score in the total islets counted in the Control or HMOS group. Average of 46 islets of each mouse from Control and HMOS mice were assigned insulitis scores. White bars present No-insulitis, light grey bars present Peri-insulitis, grey bars presents Insulitis <50%, dark grey bars present Insulitis >50%, and black bars present Complete-insulitis. (F) Mean value of mean normalized insulitis scores (range 0–4) of each mouse from control and HMOS groups are shown. Data are presented as mean ± SEM, n = 19–20/group. Statistical differences between groups are depicted as *p < 0.05, **p < 0.01, ***p < 0.001 and ****p < 0.0001 using Mann-Whitney U-test.

