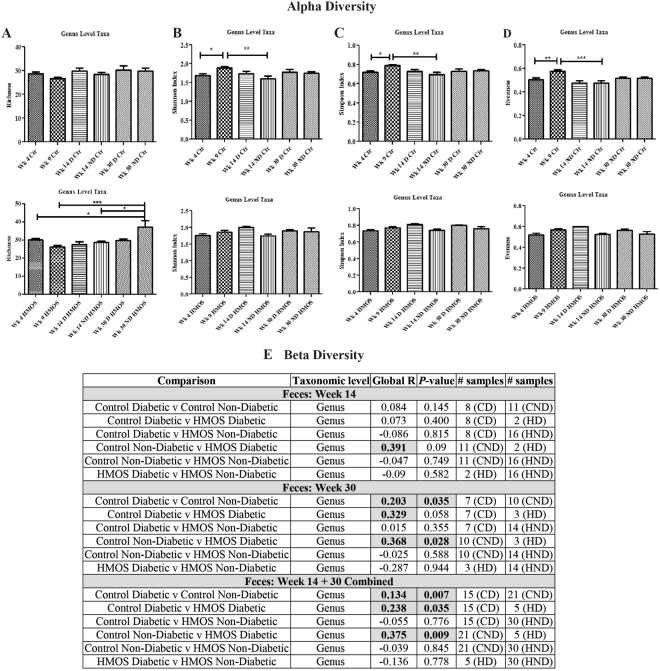
Figure 4.
Early HMOS dietary intervention changes the alpha diversity and beta diversity of fecal microbiota of the non-diabetic and diabetic mice within each group at four collection points. (A) richness. (B) Shannon’s index. (C) Simpson’s index. (D) evenness. Alpha diversity indices data are represented as mean ± SEM, n = 17–20/ group, *p < 0.05, **p < 0.01, ***p < 0.001, using one-way ANOVA test. (E) Inter-group analysis of similarity (ANOSIM) (Beta diversity). Global R comparison was based on ANOSIM performed within the software R package, as described in the text. P-values were calculated based on a permutational analysis, employing 9,999 permutations. p < 0.05, n = 17–20/group. CD: Control Diabetic; CND: Control Non-diabetic; HD: HMOS Diabetic; HND: HMOS Non-diabetic.

