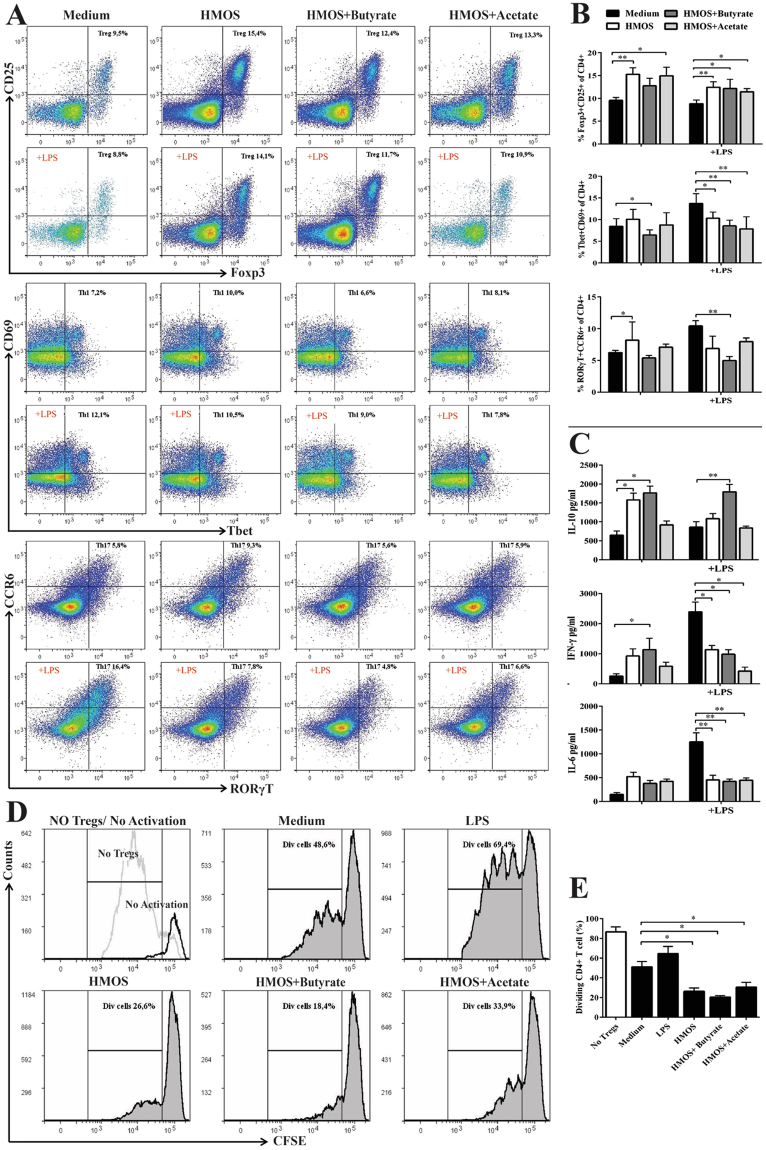
Figure 7.
HMOS−, HMOS + butyrate-, and HMOS + acetate-modulated DCs limit effector T cells and promote functional Tregs differentiation. (A) Co-cultured splenic naïve T cells were analyzed by flow cytometry, gating strategy shown in Fig. S9. Representative plots of Foxp3 + CD25 + (Treg), Tbet + CD69 + (Th1), and RORγT + CCR6 + (Th17) CD4 T cells primed by different DCs are shown. (B) Percentage of Treg, Th1, and Th17 cells of CD4 cells primed by medium- (black bars), HMOS− (white bars), HMOS + butyrate- (dark grey bars), HMOS + Acetate-DC (grey bars). (C) IL-10, IFN-γ, and IL-6 levels in the supernatant at day 6 from co-culture. (D) Representative plots and (E) the degree of responder T cell proliferation after co-culturing with Tregs primed by different DCs, gating strategy is shown in Fig. S10. CFSE-labeled naïve CD4 + T cells as responder cells were co-cultured with Tregs primed by different DCs at ratio of 1:1 for 4 days, CD3/CD28 beads were used to activate the responder T cells. Proliferation of FITC-positive cells was analyzed by flow cytometry and suppressive functionality was determined by comparing the dividing (Div) CD4 + T cells. Data are presented as mean ± SEM, 4 independent allogenic stimulation assays and 3 independent suppressive assays were performed. Statistical differences between groups are depicted as *p < 0.05, **p < 0.01 and ***p < 0.001 using Mann-Whitney U-test.

