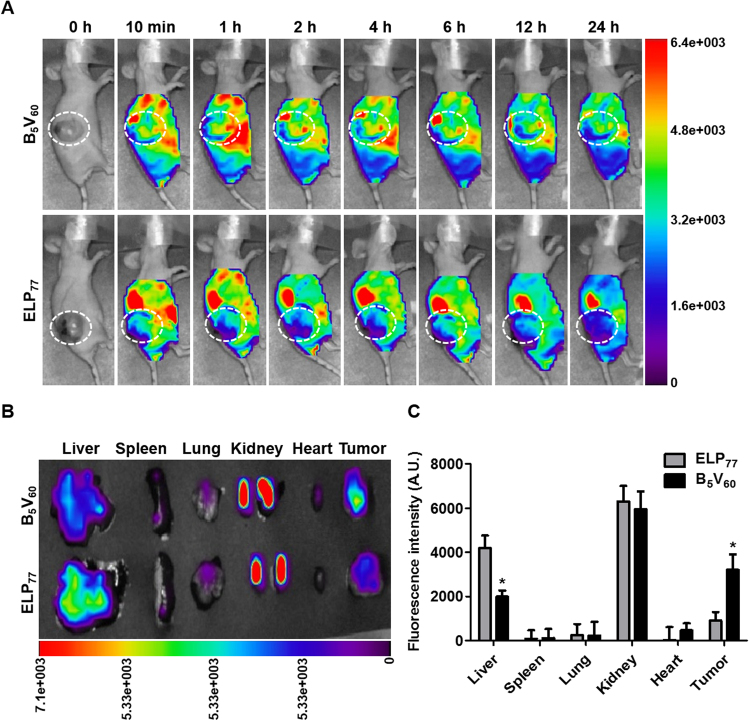
Figure 6.
In vivo imaging and biodistribution of B5V60. (A) ELP77 and B5V60 labeled with FNR 675 were intravenously injected into 5637 tumor xenograft nude mice. Fluorescence images were taken at different time intervals such as 0.1, 1.2, 4, 6, 12, and 24 h to study biodistribution in vivo (n = 10). Scale bar indicates normalized fluorescence intensity. (B) Fluorescence images of excised organs and tumor at 24 h after intravenous injection. Representative images of subsequent 10 experiments. Scale bar indicates normalized fluorescence intensity. (C) Analysis of fluorescence intensities of excised organs, including tumor tissue (n = 8). *P < 0.05 (Student’s t-test) for ELP77 versus B5V60.

