Figure 6.
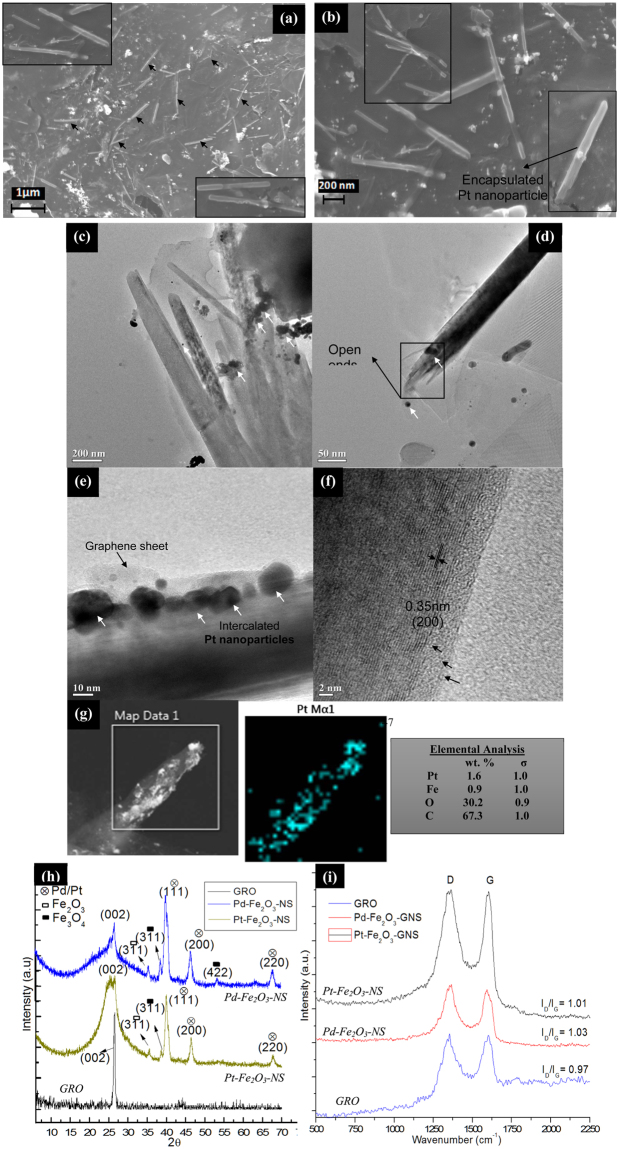
(a) FESEM micrographs of the fabricated Pt-Fe2O3-NS (marked with black arrows), (b) FESEM micrograph at higher resolution (with the inset showing a single GNS with the encapsulated Pt nanoparticle in its centre), (c) and (d) TEM micrographs of the Pt-Fe2O3-NS with the encapsulated Pt nanoparticles in it (marked with white arrows) (d’) Inset displays the magnified open end of the Pt-Fe2O3-NS (marked with rectangular box), (e) TEM micrograph of a edge of Pt-Fe2O3-NS which shows the graphene sheets rolled (marked with black arrows) with the Pt nanoparticles (marked in white arrows) encapsulated in its core and surface. (f) HRTEM micrographs of Pd-Fe2O3-NS illustrating the presence of lattice fringes of graphene, (g) and (g’) FESEM-EDX mapping of the selected region (marked in white box) showing the distribution of the Pt element on Pt-Fe2O3-NS and (h) compositional analysis of the elements in the Pt-Fe2O3-NS. (h) XRD diffractograms and (i) Raman spectroscopy of the Pt and Pd-Fe2O3-NS fabricated using catalytically active Pt-Fe2O3-CNCs and Pd-Fe2O3-CNCs as the structural directing templates.

