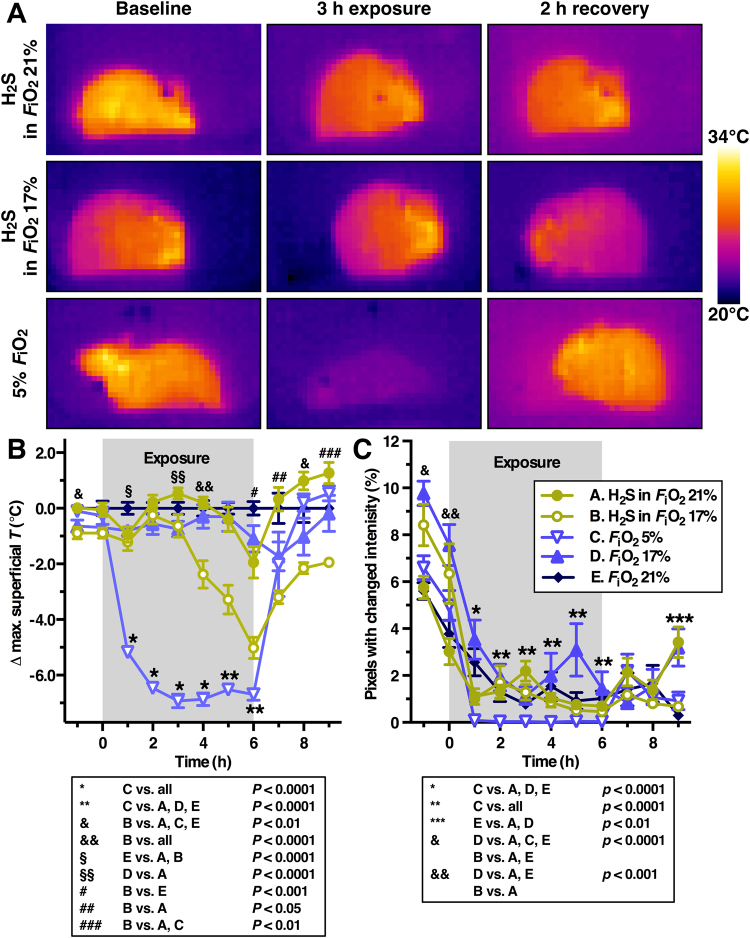
Figure 3.
Temperature and locomotor effects of H2S compared to hypoxia. (A) Thermal images of H2S-exposed mice in 21% O2 (top row), in 17% O2 (middle row), and hypoxia-subjected mice (bottom row) before (baseline), during, and after (recovery) exposure. The color of the animals reflects their temperature (scale bar). (B) The difference between the maximum superficial temperature (Δ max. superficial T) of the hypoxia (FiO2 5% and 17%) and H2S (FiO2 17% and 21%) groups versus the normoxia group (FiO2 21%) was plotted as a function of time before exposure (up to 0 h), during exposure (0–6 h), and after exposure (6–9 h). (C) Mouse mean locomotor activity per time point per group plotted as a function of time before exposure (up to 0 h), during exposure (0–6 h), and after exposure (6–9 h). Locomotor activity was derived from temporal changes in pixel grayscale intensity as described in the online supplemental information. In (B) and (C) the means ± SEM are plotted for N = 12/group (group A, C and E) or N = 6/group (group B and D) up to 6 h, and for N = 6/group from 6 to 9 h. Statistically significant intergroup differences are displayed under the corresponding plots.

