Figure 3.
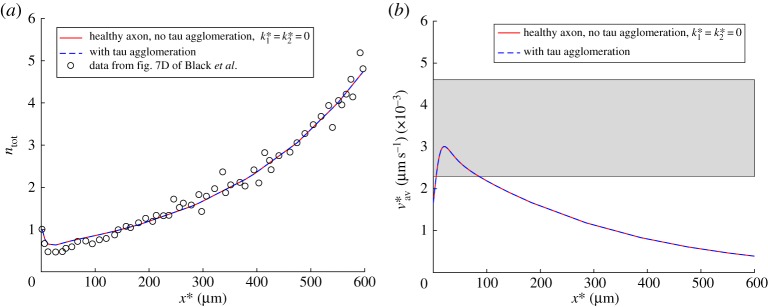
(a) A comparison between model predictions and experimental results reported in fig. 7D of ref. [31] for the dimensionless total concentration of tau protein, . Experimental data were rescaled such that ntot at x* = 0 was equal to unity. (b) A comparison between model predictions of the average tau velocity, defined by equation (2.12), and the experimental range for this quantity reported in ref. [32] (shown by a horizontal band). To demonstrate that even for the case with tau agglomeration, all components of the total tau concentration, except for nmis, can be computed from steady-state equations (see equations (2.1)–(2.5), (2.7) and (2.8)), we show computational results for a healthy axon (with no tau agglomeration) and for an axon with tau agglomeration. Results with tau agglomeration are shown at the time when nmis(x*) reaches its steady-state distribution. (Online version in colour.)

