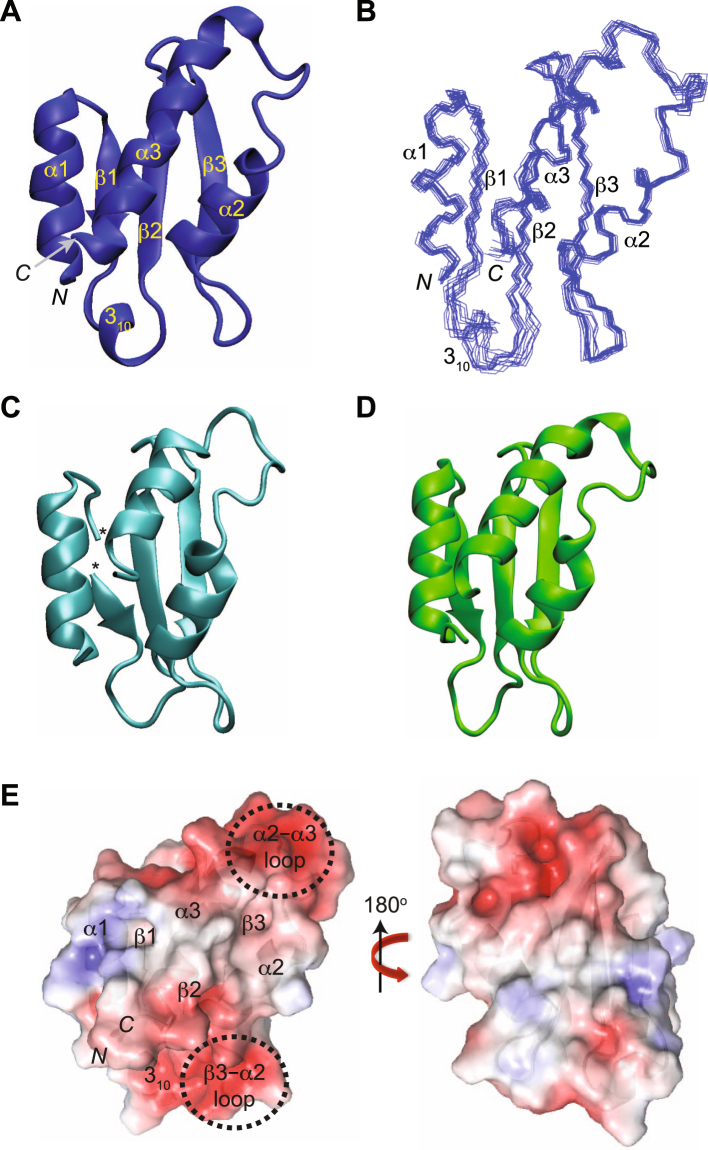
Figure 1.
Structures of AcrIIA4 as ribbon and surface representations. (A) Solution structure of AcrIIA4 in the free state. Secondary structures, as well as N- and C-termini are annotated. (B) Superposition of the backbone atoms of the final 20 simulated annealing structures of AcrIIA4. The structures are best-fit superposed against well-ordered secondary structures between residues 2–13, 16–19, 29–33, 40–44, 50–59, and 68–85. (C) AcrIIA4 from the crystal structure of the AcrIIA4–SpyCas9–sgRNA complex (PDB code 5XBL). (D) AcrIIA4 from the crystal structure of the AcrIIA4–SpyCas9–sgRNA complex (PDB code 5VW1). (E) Front and backside view of molecular surface representations of AcrIIA4 color-coded by electrostatic potential, ±5 kT. AcrIIA4 on the left panel is drawn in the same orientation as in (A).

