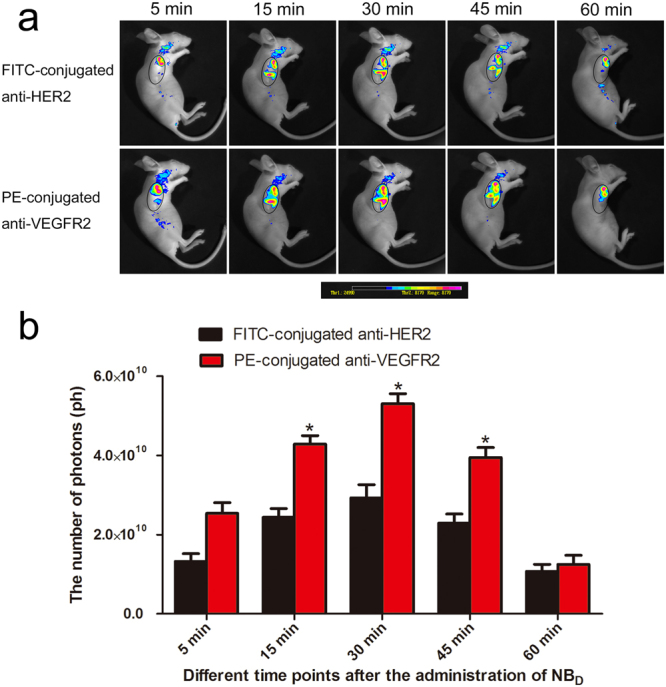
Figure 9.

(a) In vivo time-dependent fluorescence images in breast tumor bearing-mice at different time points after the administration of NBD under the different detection modes of fluorescent-conjugated antibodies. The tumor area was outlined in an oval shape. The color bar (from blue to red) indicates the change in fluorescence signal intensity from low to high. (b) Quantification of fluorescence signals of the tumor area at different time points after the administration of NBD. *P < 0.05.
