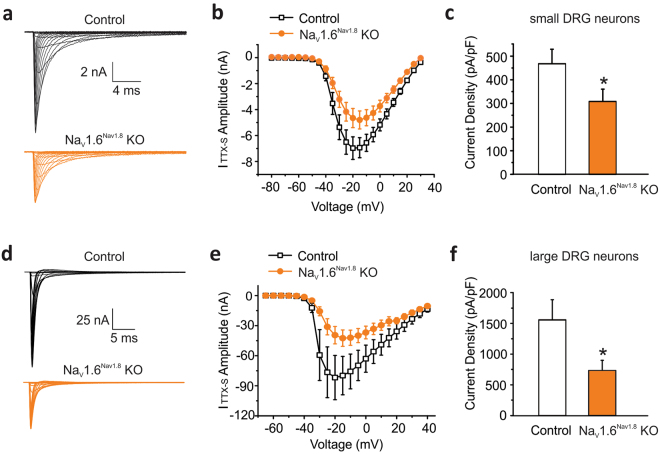
Figure 1.
Contribution of NaV1.6 to TTX-sensitive sodium current in small and large DRG neurons in NaV1.8 driven Nav1.6 knock out mice. (a) Representative traces of TTX-S currents recorded in small DRG neurons from heterozygous NaV1.8+/CreNaV1.6+/flox (Control, black lines) and NaV1.8+/CreNaV1.6flox/flox (NaV1.6Nav1.8 KO, orange lines) mice. Cells were held at −100 mV and stepped to membrane potentials from −80 to +30 mV in 5 mV increments (100 ms) to record voltage-dependent sodium currents. (b) The current-voltage (I-V) relation curves for TTX-S sodium currents in small Control (n = 13) and NaV1.6Nav1.8 KO (n = 15) KO DRG neurons. (c) Current densities of TTX-S sodium currents in small Control (n = 13) and NaV1.6Nav1.8 KO (n = 15) DRG neurons. (d) Representative traces of TTX-S sodium currents recorded in large DRG neurons from heterozygous NaV1.8+/CreNaV1.6+/flox (Control) and NaV1.8+/CreNav1.6flox/flox (NaV1.6Nav1.8 KO) mice. Cells were held at −70 mV, prepulsed to −100 mV for 500 ms, and stepped to membrane potentials from −65 mV to +40 mV in 5 mV increments (100 ms) to record the voltage-dependent sodium currents. (e) The current-voltage (I-V) relation curves for TTX-S sodium currents in large Control (n = 5) and NaV1.6Nav1.8 KO (n = 7) DRG neurons. (f) Current densities of TTX-S sodium currents in large Control (n = 5) and NaV1.6Nav1.8 KO (n = 7) DRG neurons. Data are presented as mean ± SEM. *p < 0.05 based on unpaired t test.

