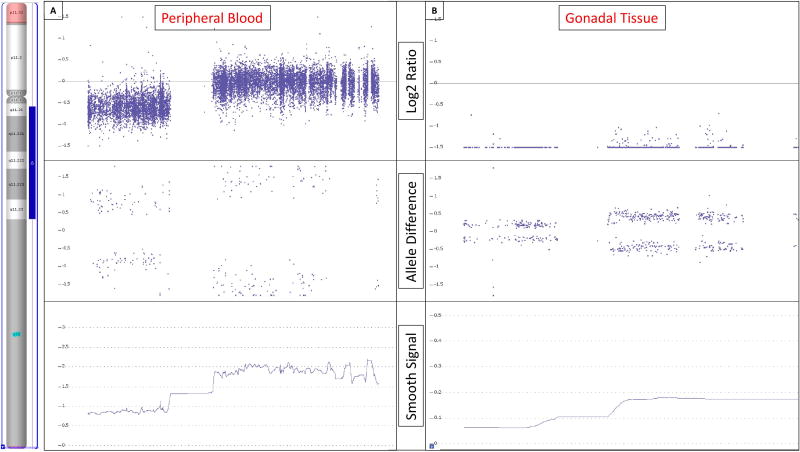
Figure 2.
Chromosome microarray analysis results. The region that is duplicated on the long arm of the Y chromosome is indicated by the blue bar in the ideogram on the left. [A] Chromosome microarray analysis performed on DNA extracted from peripheral blood showed an 86% prevalence of Y chromosome material with a duplication of the entire euchromatic region of the the long arm (blue bar). The duplication is identified by the higher Log2 ratio observed for probes in the long arm compared to those in the short arm as seen in the Log2 Ratio panel. [B] Chromosome microarray analysis performed on DNA extracted from gonadal tissue paraffin sections showed the same duplicated Y chromosome but at a 6.5% prevalence. The Log2 ratios in panel B are distinctly diminished compared to panel A, indicating a very low presence of Y-chromosomal material. However, the Log2 ratio in the long arm remains noticeably increased over the short arm, representing the same structural Y chromosome as seen in peripheral blood but at a much lower prevalence. The allele difference panels indicates the genotype for each SNP probe. For normal copy number of 2, there are only 3 possible SNP combinations, AA, AB and BB which are plotted on the allele difference graph. When there is a single copy of a region (copy number of 1), the genotype options are either A or B and thus only two distinct tracks are visible on the allele difference graph. When the same region is duplicated, as in the long arm of the Y chromosome, there remains only 2 genotypes but they are represented as AA and BB. The smooth signal copy number panels indicate the exact copy number of each probe. This panel is helpful in identifying mosaicism which is evident when the smooth signal for multiple consecutive probes lies between an integer, e.g. between 1 and 2. The level of mosaicism in peripheral blood is markedly higher compared to that observed in gonadal tissue.

