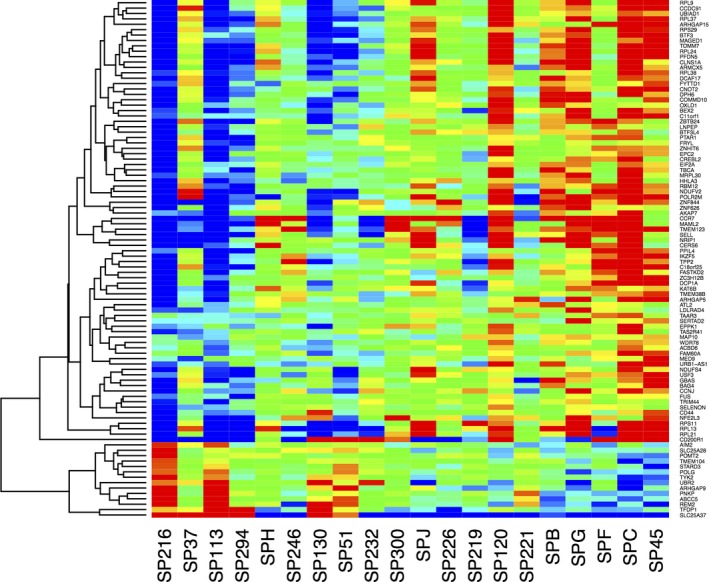
Figure 2.

Heat map of expression of 96 transcripts correlated with SMX‐HA cytotoxicity in PBMCs from 20 patients using by the YO‐PRO method. The 20 samples are listed along the x‐axis in order of lowest (left) to highest (right) % cytotoxicity. Red indicates highest expression, blue lowest expression
