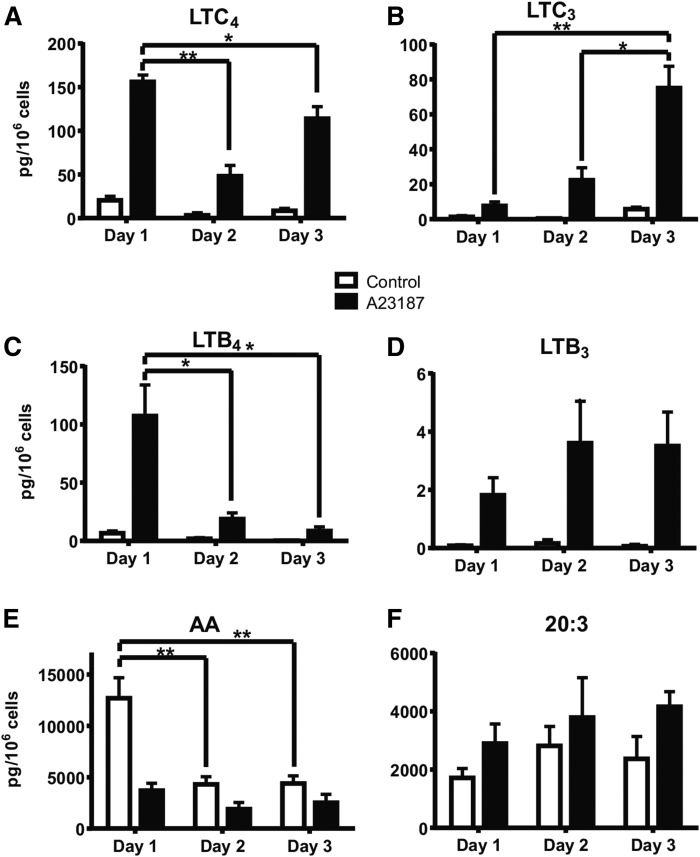
Fig. 2.
Levels of 20:4 and 20:3 fatty acids and their 5-lipoxygenase products that appear in the supernatant of RAW 264.7 cells carried in culture for the indicated number of days and then stimulated (or not) with calcium ionophore A23187. A: LTB4 production. B: LTB3 production. C: LTC4 production. D: LTC3 production. E: Free 20:4 accumulation. F: Free 20:3 accumulation. Data are expressed as average ± SEM, n = 3. Significance comparisons, *P < 0.01, **P < 0.001.

