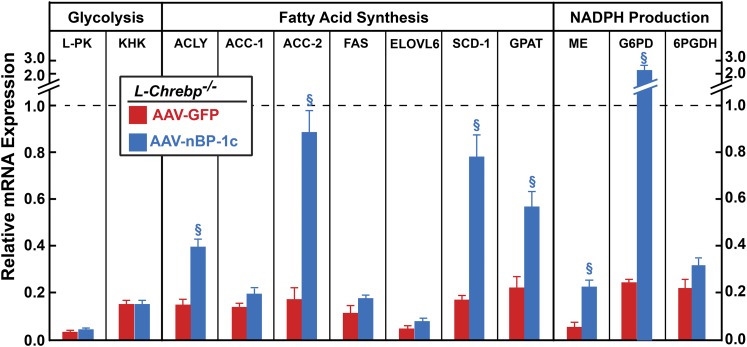
Fig. 6.
Relative gene expression in the livers from sucrose-refed control and L-Chrebp−/− mice treated with AAV-GFP or AAV-nSREBP-1c. The mice used here were the same as those in Fig. 5. Total liver RNAs were prepared and subjected to real-time PCR analysis with ApoB as the invariant control. For brevity, only the sucrose-refed groups were shown here, and the mRNA expression was plotted as the amount relative to that in livers of sucrose-refed control mice, which was arbitrarily defined as 1.0 and indicated as a dotted line. Each bar represents the mean ± SEM of values from four to six mice per group. §P < 0.01 denotes the level of statistical significance between sucrose-refed L-Chrebp−/− mice injected with GFP or nBP-1c. Additional mRNA values from this experiment are shown in supplemental Table S3. G6PDH, glucose-6-phosphate dehydrogenase.

