Figure 2.

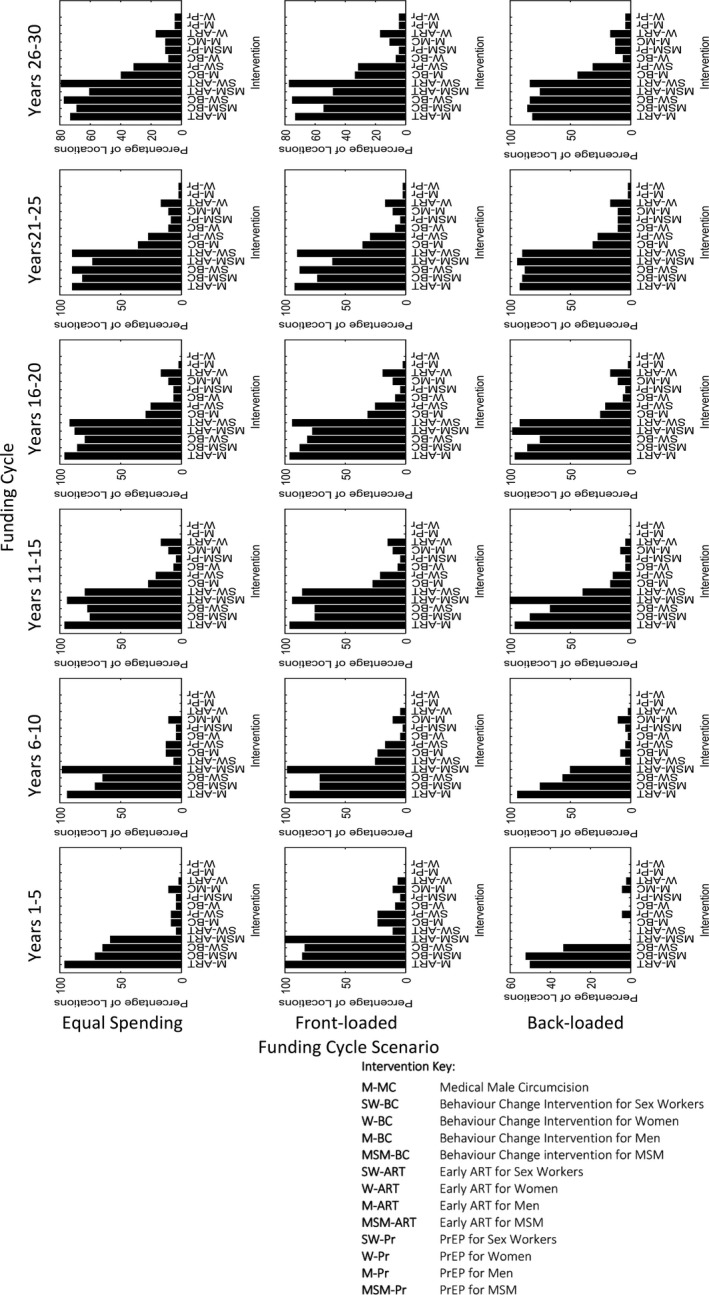
The percentage of locations implementing each intervention by risk population, across each of the six funding cycles (columns) under the three different funding cycle scenarios (rows).

The percentage of locations implementing each intervention by risk population, across each of the six funding cycles (columns) under the three different funding cycle scenarios (rows).