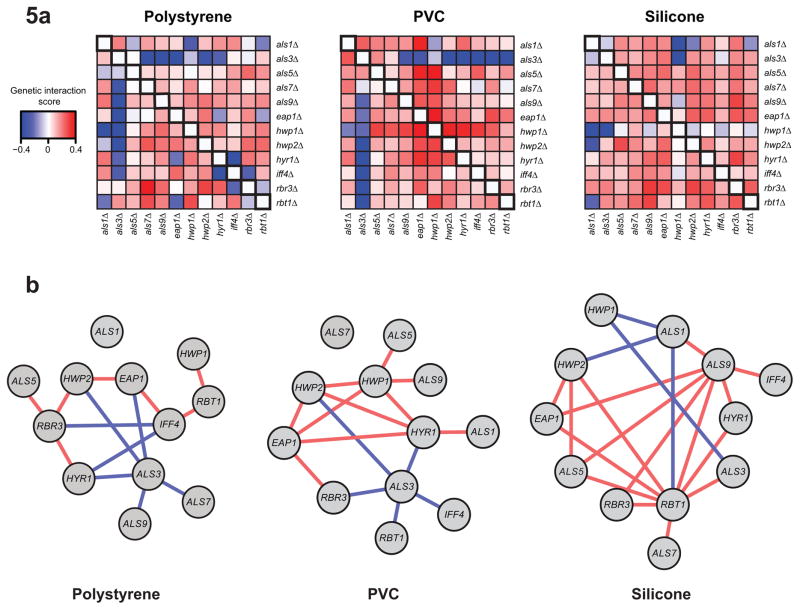
Figure 5. C. albicans double adhesin deletion matrix highlights critical factors and genetic interactions for biofilm growth.
(a) Heatmaps depicting average genetic interaction scores (ε) of single and double adhesin gene deletions grown on a polystyrene, PVC, or silicone biofilm. ε is defined as the difference between the measured fitness and the expected fitness based on a multiplicative model, where fitness is defined as optical density (OD) at 490nm of the mutant and normalized to OD of the wild-type parental strain (see Methods). Blue represents a negative interaction score and red represents a positive interaction score; values along the diagonal are zero, indicating no interaction for single knockouts. (b) Genetic interaction map in which red indicates a significantly positive interaction and blue represents a significantly negative interaction. Significant positive interactions are defined as an adjusted p-value<0.05 and ε>0; significant negative interactions are defined as an adjusted p-value<0.05 and ε<0. The maps were generated using Cytoscape

