
Figure 5.
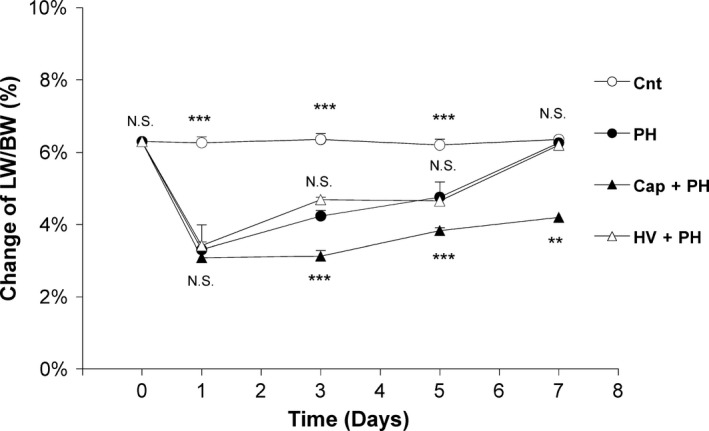
Effect of neural relay on liver weight‐to‐body weight ratio after partial hepatectomy. Time‐dependent changes of liver weight‐to‐body weight ratio after partial hepatectomy in the Cnt, PH, Cap + PH, and HV + PH groups. Liver weight (LW)‐to‐body weight (BW) ratio was measured in each of the five mice from the four groups at appropriate time points. The values represent mean ± SD (n = 5 for each value). **P < 0.01, ***P < 0.001, and N.S., no statistical significance compared with the PH group. Two‐way factor repeated‐measures analysis of variance followed by Bonferroni's multiple comparison test.