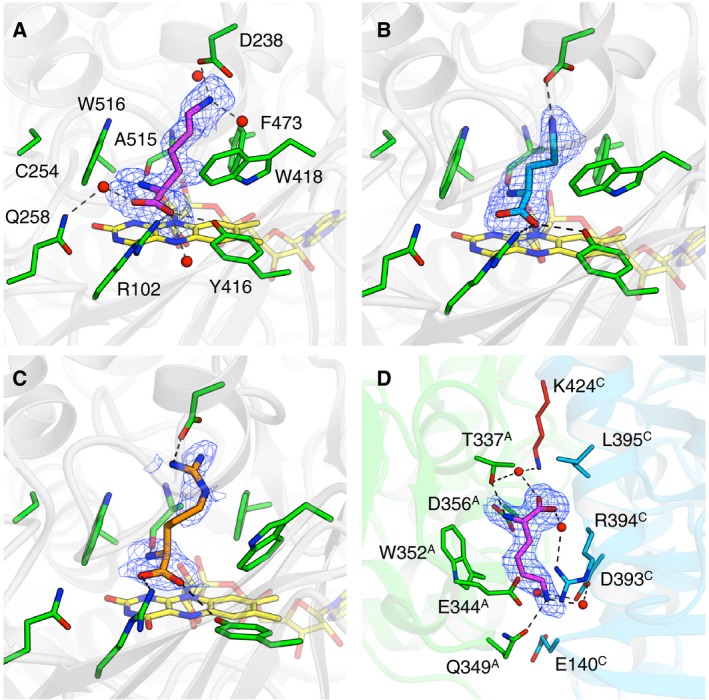
Figure 3.

Substrate binding sites of l‐ AAO/MOG. (A) l‐Lys (magenta), (B) l‐Orn (cyan), and (C) l‐Arg (orange) in the active site. FAD molecule is shown as yellow sticks. (D) The second substrate binding site between the dimer of chains A and C. mF o–F c omit electron density maps (2.5σ, blue mesh) are shown.
