Figure 5.

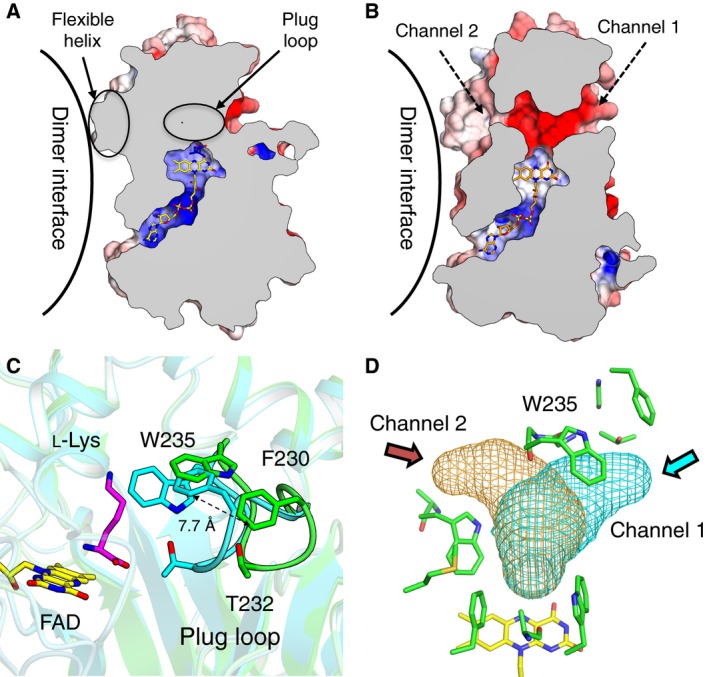
Conformational change between the ligand‐free and l‐Lys complex structures of l‐ AAO/MOG. Cross section of a monomer of (A) l‐Lys complex and (B) ligand‐free structures showing the internal cavities and channels. (C) Active site of ligand‐free (green) and l‐Lys complex (cyan). (D) Channels to solvent are displayed as meshes.
